Not counted Official unemployment numbers do not
reflect those long-term unemployed workers who have given up
finding work or who are forced to work part-time.
It’s over?
The recession is over ... officially in March 2002.
The Iraq war is over ... in May 2003 when President Bush stands
below a sign that reads “Mission Accomplished.”
The presidential election is over ... in January 2004 after the
President of the United States gives his State of the Union
address.
In precincts
where where the filthy rich live along the East River in New
York and Lake Michigan in Chicago, in the gated communities of
Dallas, Los Angeles and Miami, next to the golf courses in
Columbus, Atlanta and Phoenix – the traumas of the past four
years have hardly registered.
Where advertising executives gather for $250 lunches, where
newspaper and television editors meet to sip $20 shots of single
malt scotch, where corporate executives honor themselves at
$2,000 a plate charity dinners, the pain and suffering of
American families have become insipid insider jokes.
And in the hotel ballrooms where the president and vice
president sing that old Haliburton tune – We’re coming over. And
we won’t be back ‘til it’s over, over there – in order to rake
in a million or two for their campaign coffers, the dirty little
secret is: it’s not over.
Not over, over there.
Not over, over here.
Not over, anywhere ... until the last vote is counted.
It’s Not Over
The 2004 presidential election has only just begun. All the
headlines, all the polls, all the mini-debates, all the
predictions, all the posturing, all the position papers, all the
press releases are but the warmup acts to the main event.
The media elites want you to believe that once the parties’
nominees are known, that signals the start of the main event, an
event in which the GOP nominee has an overwhelming advantage.
They’re wrong.
The main event is the clash of haves and have nots. It occurs on
November 2, 2004 but it has been building in intensity for four
years. On Election Day, over one hundred million Americans will
go vote.
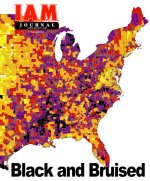
The issue that will determine how the vast majority will vote is
graphically portrayed on the cover pages of this IAM Journal.
That map shows a black, bruised and bleeding America.
Black covers counties where the unemployment rate is over 10
percent.
Purplish blue – the color of a bruise – stains counties where
the unemployment rate is between seven and 9.9 percent.
Brown and red show the counties where the unemployment rate is
between five and 6.9 percent. Those are the official numbers!
The map was created by the U. S. Department of Labor, and was
found on the Bureau of Labor Statistics web page. It shows the
county-level unemployment rate as of October 2003.
Cover Story:
Part 1 |
Part 2 |
Part 3 |
Part 4 |
Part 5
|
|