Gross Domestic Product
Real GDP (a measure of economic growth) has increased from $385 billion since 2009 to reach a high of $458 billion in 2018.
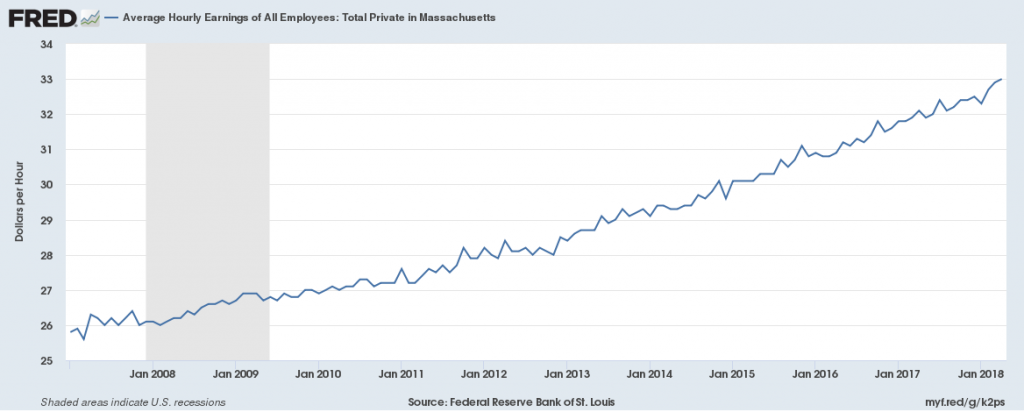
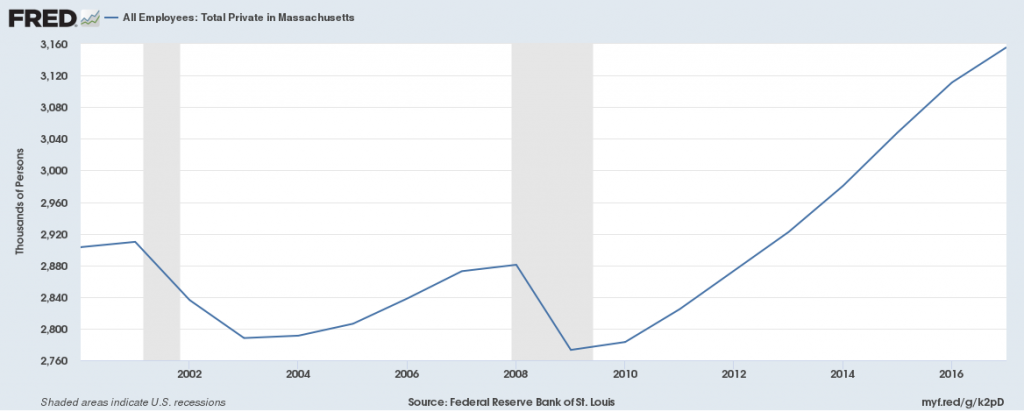
Jobs
Massachusetts’ Private-sector employers added 380,000 jobs since February 2010. From 2016-2017, Massachusetts’ private sector added 40,000 jobs. Average hourly wages have been increasing steadily since 2008, going from approximately $26/hr to $33/hr.
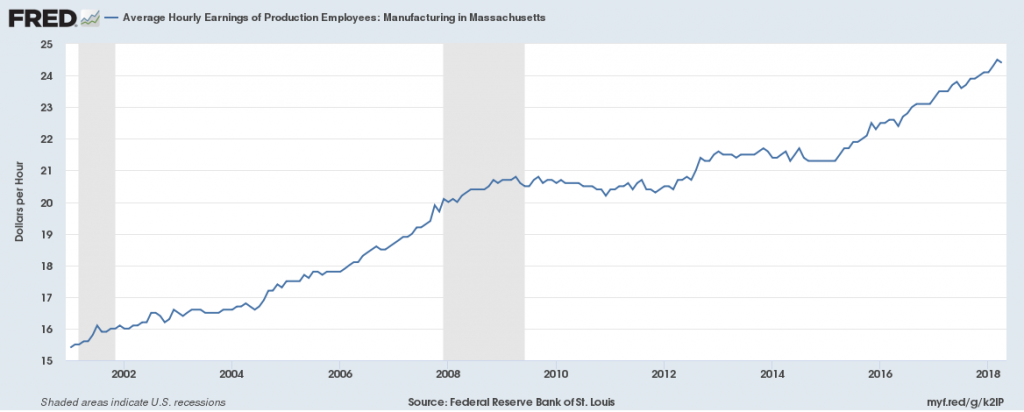
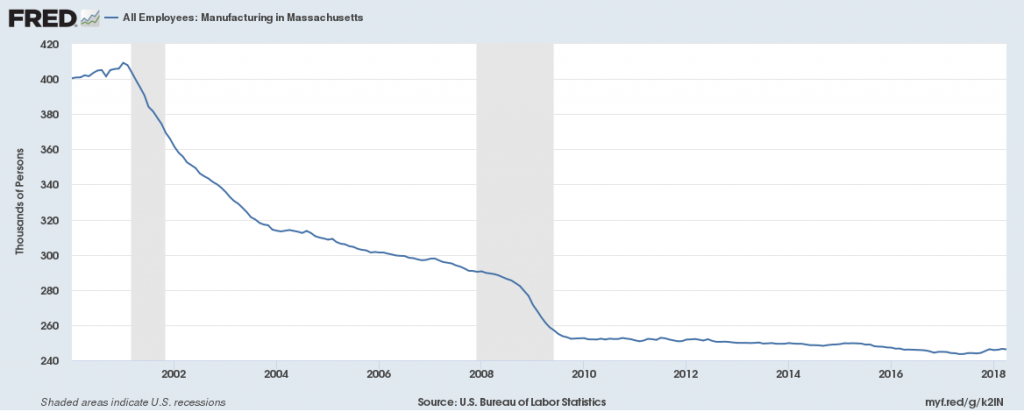
Manufacturing employment has declined steadily since 2002, especially during the 2008 recession. There are currently 245,000 jobs in this sector in 2018, down from 400,000 in 2000. Average hourly wages of production employees have been increasing steadily, up from $15.50/hr in 2000 to $24.5/hr in 2018.
Trade, Transportation and Utilities employment has increased since 2008, going from approximately 71,000 workers to 88,000 workers. Average hourly wages of these workers have been increasing steadily, up from $23/hr in 2008 to $27/hr in 2018.
![]()
![]()
Unemployment
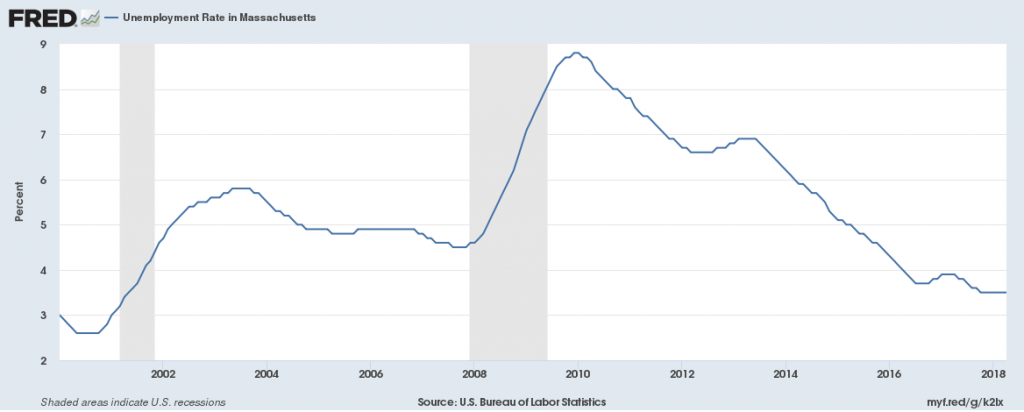
The unemployment rate in Massachusetts was 3.5% in 2018, down .5% points from 2017. The rate is below the national average of 3.9%.
Housing
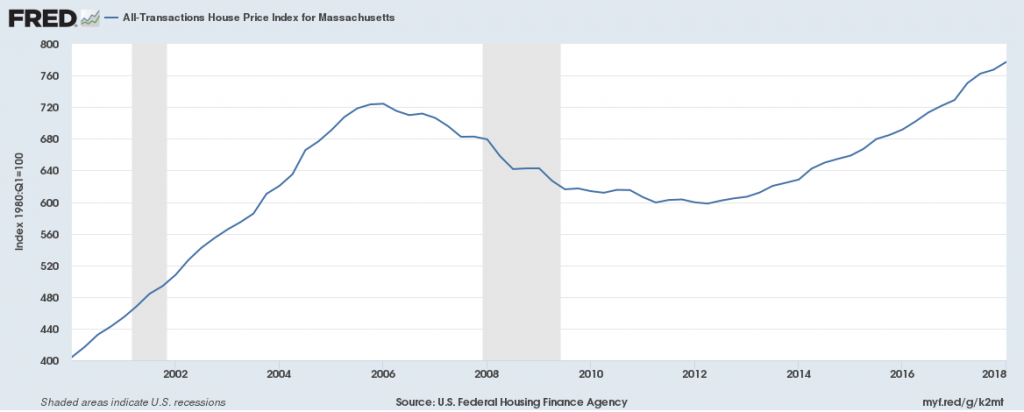
The House Price Index, a measure of the cost of housing, in Massachusetts declined from 2008 to 2014, but has been increasing since then to a high of 770, showing an increase in home prices.
Home prices in Massachusetts increased by 5.3 percent from the second quarter of 2013 to the second quarter of 2014. They are up 7.9 percent since their recent low in the second quarter of 2012 but remain at 10.2 percent below their pre-housing-crash peak.
Boston-Cambridge-Nashua Region
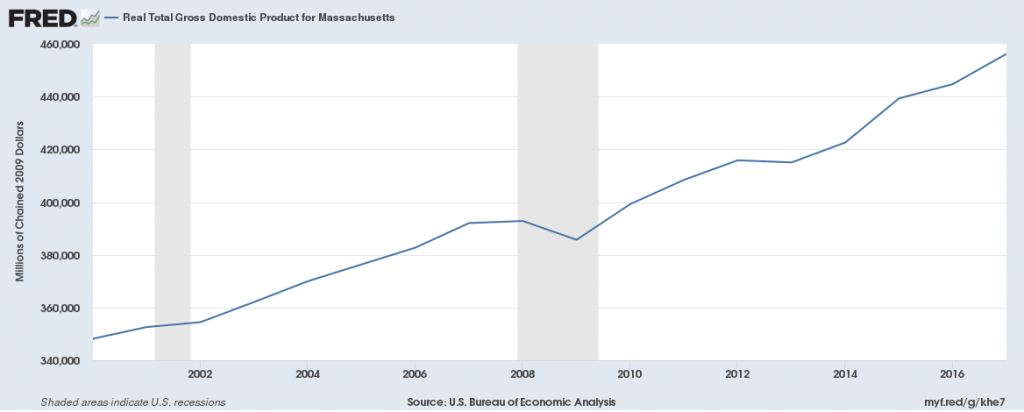
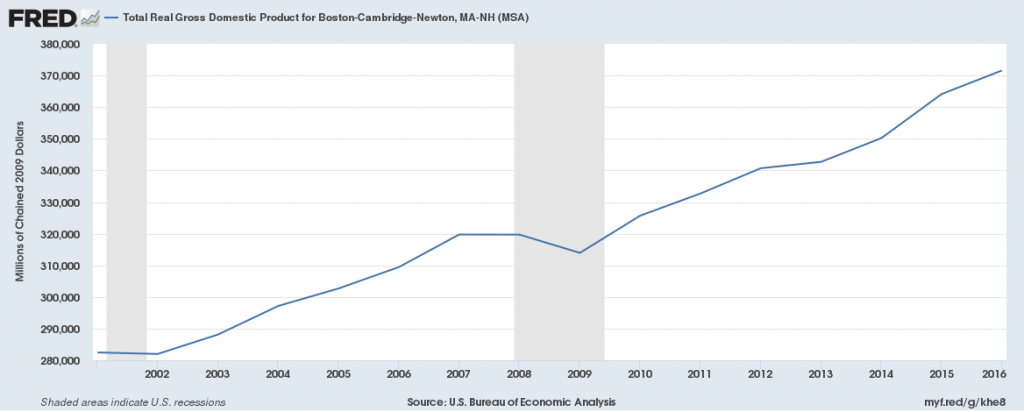
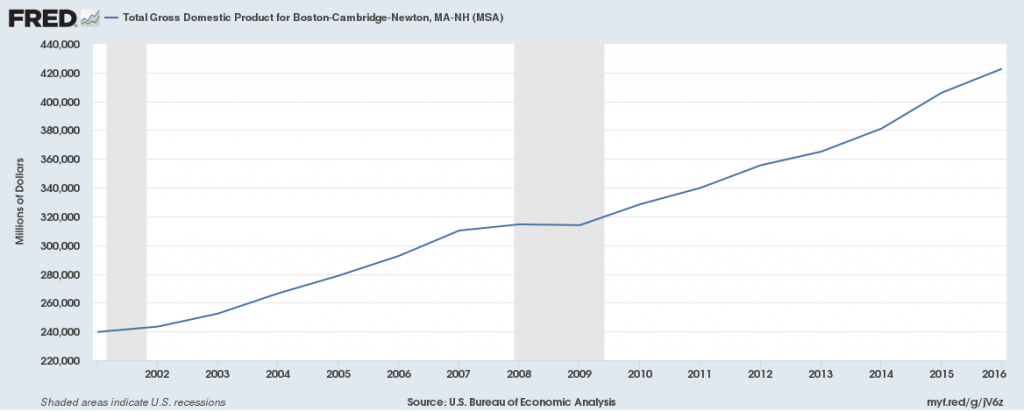
Gross Domestic Product
Real GDP (a measure of economic growth) has increased from $240 billion since 2000 to reach a high of $420 billion in 2018.
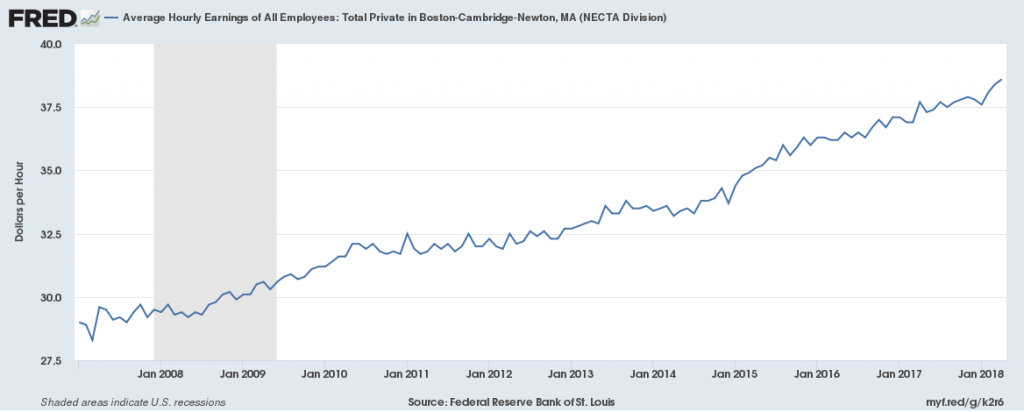
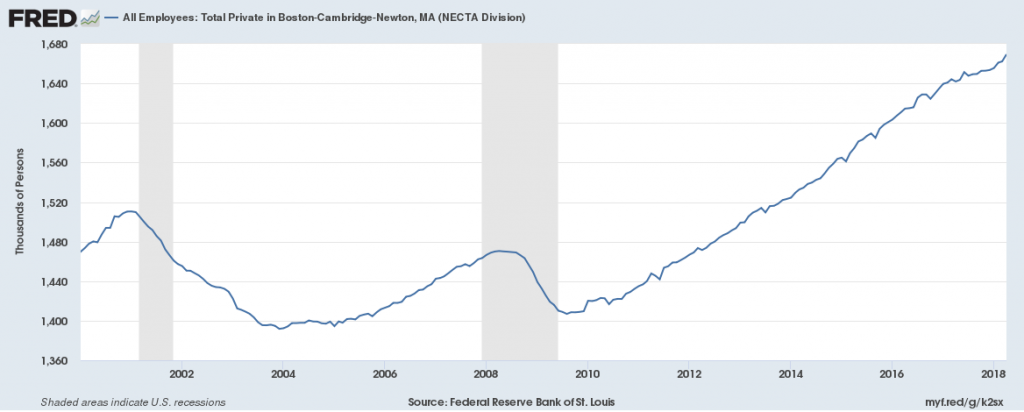
Jobs
Private sector employment has increased since its 2010 low of 1,440,000 in 2010 to its current high of 1,670,000 in 2018. Average hourly wages have increased from approximately $31/hr in 2010 to $39/hr in 2018.
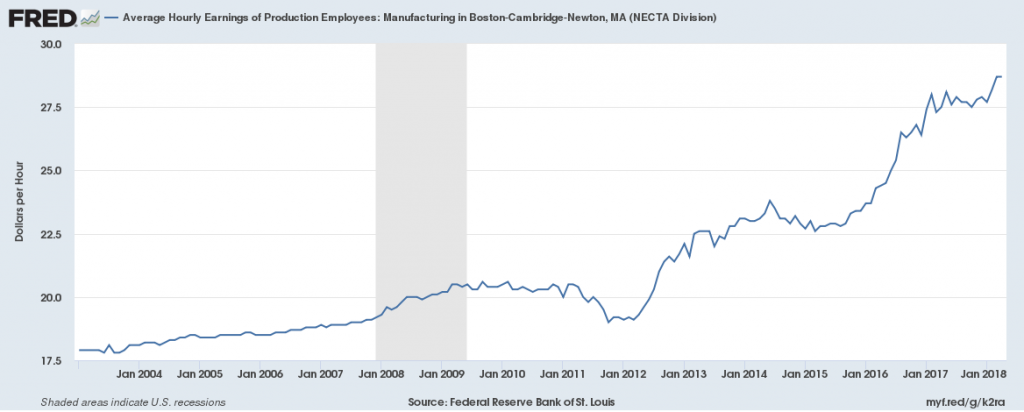
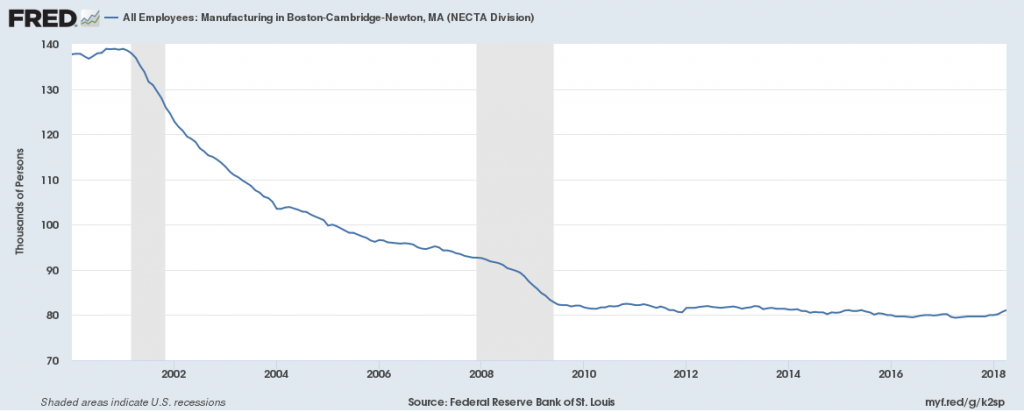
Manufacturing employment has declined steadily since 2002, especially during the 2008 recession. There are currently 82,000 jobs in this sector in 2018, down from 140,000 in 2000. Average hourly wages of production employees have been increasing steadily, up from $20/hr in 2010 to $29.25/hr in 2018.
Trade, Transportation and Utilities employment has increased since 2010, going from a low of approximately 38,500 workers to 44,250 workers in 2017. The average wage in this sector was $19.48/hr in 2017.
![]()
Unemployment
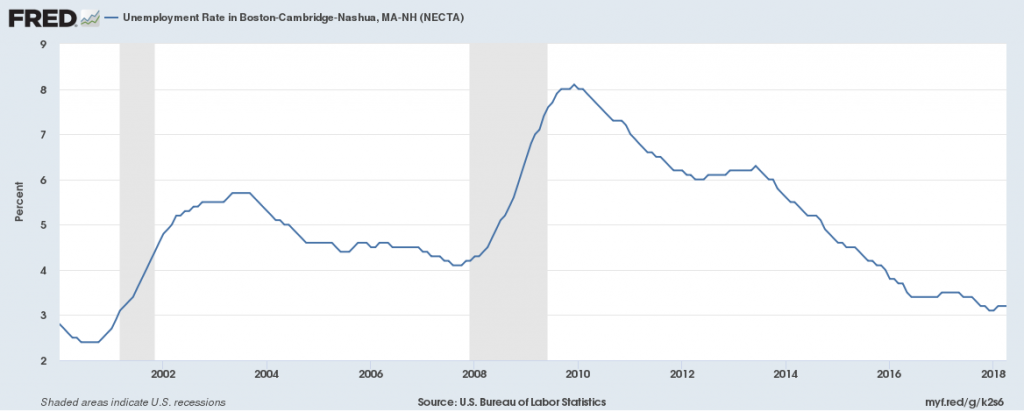
The unemployment rate in the area was 3.2% in 2018, down .3% points from 2017. The rate is below the national average of 3.9%.
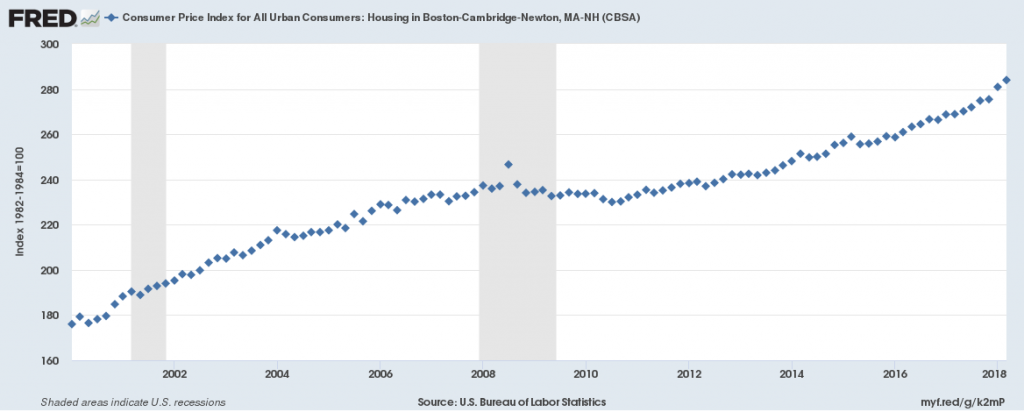
Housing
The Consumer Price Index for Housing (a measure of housing costs) in the area has been increasing steadily since 2000 to a high of 285, reflecting higher housing costs.