Gross Domestic Product
Real GDP (a measure of economic growth) increased from 2009-2017, going from $243 billion to $280 billion.
Jobs
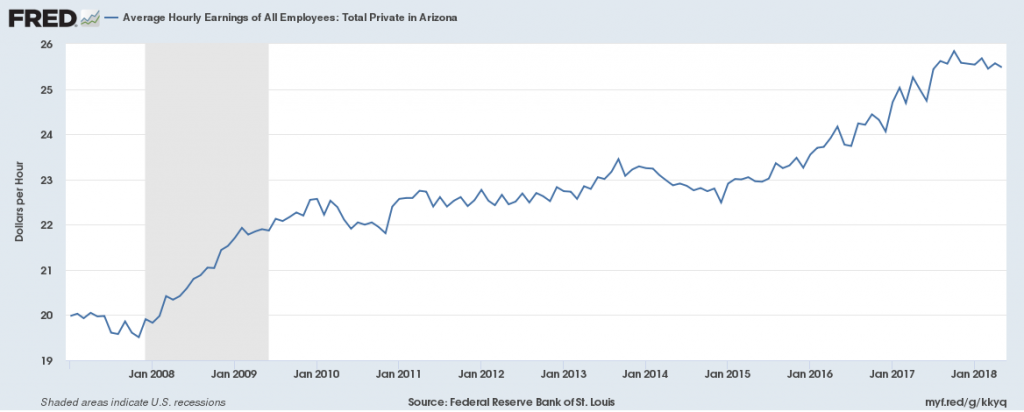
Private-sector employers have added 450,000 jobs since 2010, the national low point for private-sector employment. From 2017 to 2018 the private sector added 100,000 new jobs. There were 2,400,000 total jobs in the private sector in 2018, slightly above pre-recession levels. Average hourly wages in the private sector have grown since 2008, going from $20/hr to $25.50/hr in 2018.
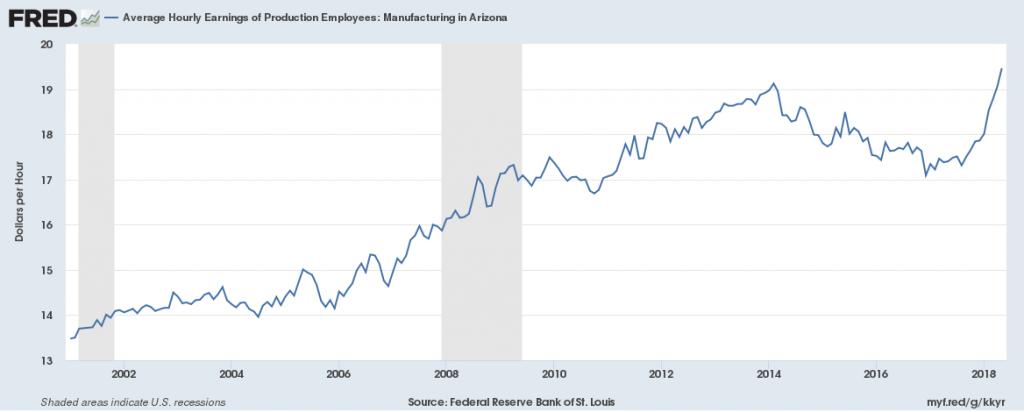
Manufacturing employment decreased since 2001, especially during the recession but slightly recovered since 2011. There were 170,000 jobs in this sector in 2018, down from 210,000 in 2001 and below pre-recession levels of 187,000. Average hourly wages of manufacturing employees have grown since 2001, going from $13.50/hr to $19.50/hr by 2018.
There were 100,000 jobs in the Transportation, Warehousing and Utilities sector in 2018, significantly above pre-recession levels by 13,000 jobs, showing growth in this sector. The average wage in this sector has been growing slowly since 2003, going from $13.50/hr to $18/hr in 2017.
![]()
![]()
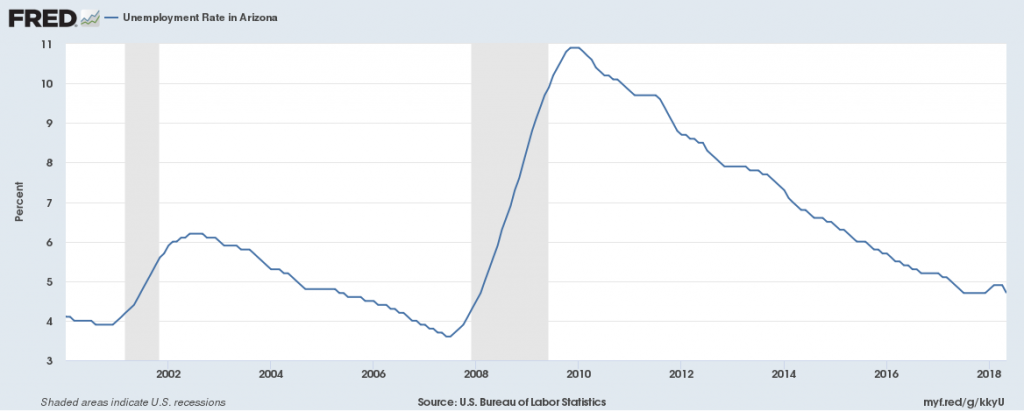
Unemployment
The unemployment rate in 2018 is 4.9%, down from the prior year’s 5.1% rate. This is above the national average of 3.9% unemployment.
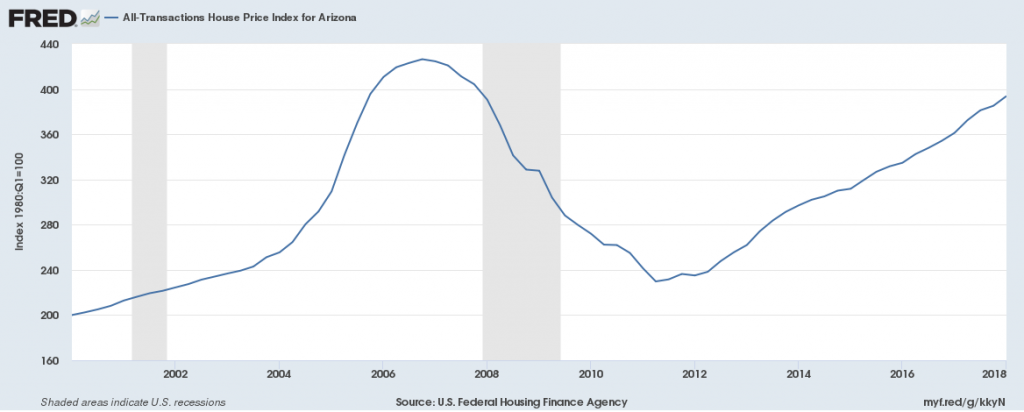
Housing
The House Price Index, a measure of the cost of housing, decreased from 2007 to 2011, but has been rising steadily since then, to almost pre-recession levels, going from 230 to 385 in 2017.
Phoenix-Mesa-Scottsdale, AZ
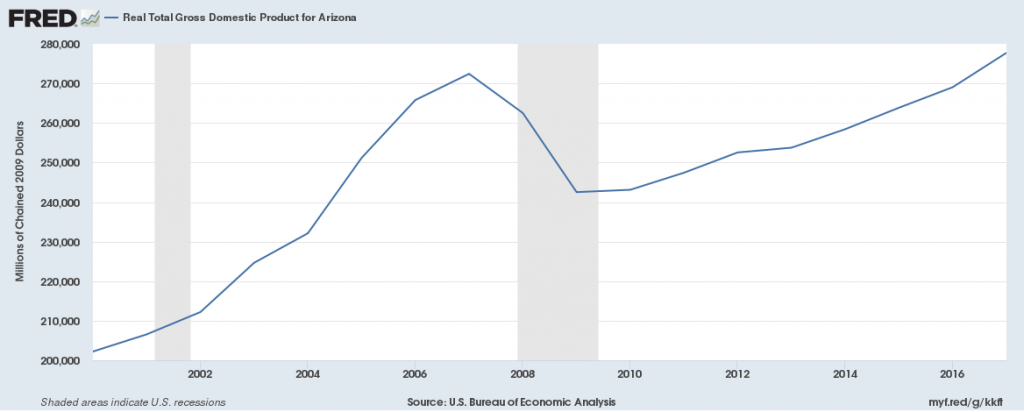
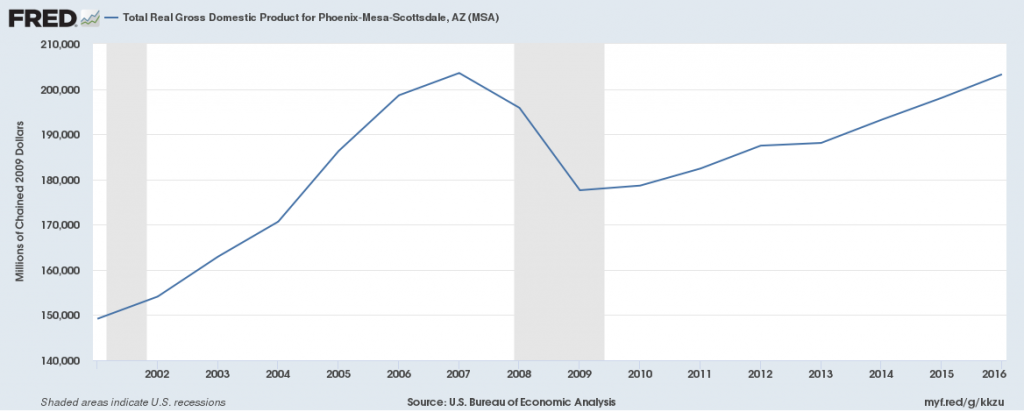
Gross Domestic Product
Real GDP (a measure of economic growth) increased from 2009-2017, going from $178 billion to $203 billion.
Jobs
Private-sector employers have added 300,000 jobs since 2010, the national low point for private-sector employment. From 2017 to 2018 the private sector added 60,000 new jobs. There were 1,850,000 total jobs in the private sector in 2018, slightly above pre-recession levels. Average hourly wages in the private sector have grown since 2007, going from $20/hr to $26.50/hr in 2018.
Manufacturing employment decreased since 2001, especially during the recession but slightly recovered since 2011. There were 128,000 jobs in this sector in 2018, down from 160,000 in 2001 and below pre-recession levels of 140,000. Average hourly wages of manufacturing employees grew from 2001-2013 and have stagnated since then, going from $13.50/hr to $19.50/hr by 2018.
There were 68,000 jobs in the Transportation and Warehousing sector in 2018, significantly above pre-recession levels by 10,000 jobs, showing growth in this sector. The average wage in this sector has been growing slowly since 2003, going from $13.50/hr to $18/hr in 2017.
![]()
Unemployment
The unemployment rate in 2018 is 4.9%, down from the prior year’s 5.1% rate. This is above the national average of 3.9% unemployment.
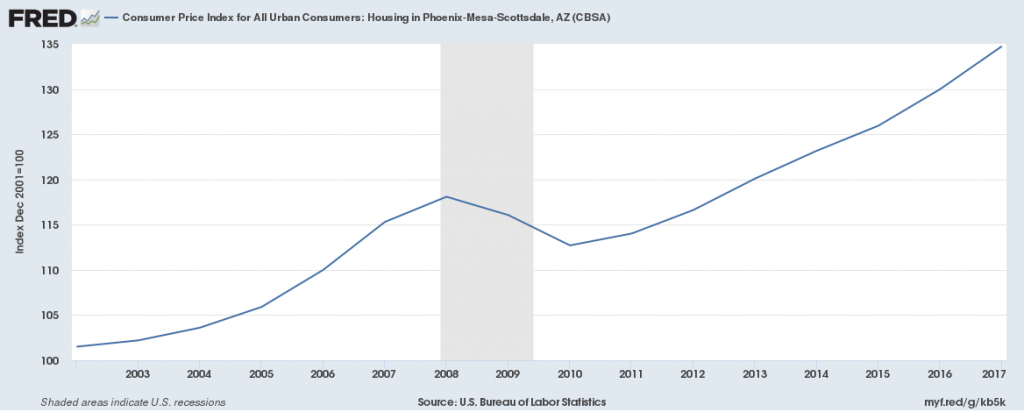
Housing
The Consumer Price Index for Housing declined during the recession but was significantly higher in 2017 than it ever was before the recession, going from 118 in 2008 to 135 in 2017, showing a large increase in housing costs.