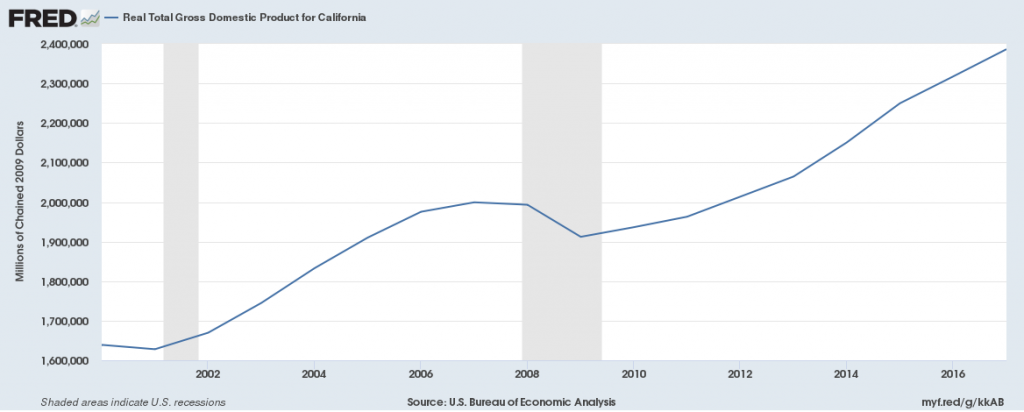
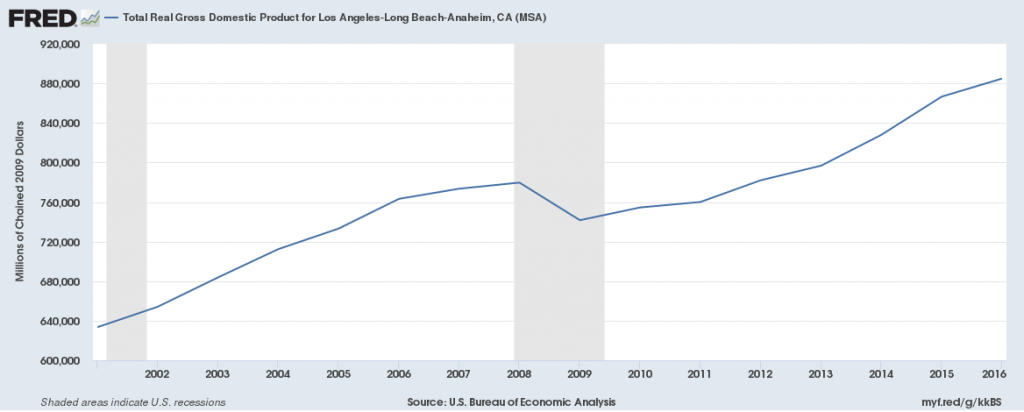
Gross Domestic Product
Real GDP (a measure of economic growth) increased from 2001-2007 and resumed growth from 2009-2017, going from $1.912 trillion in 2009 to $2.4 trillion in 2018.
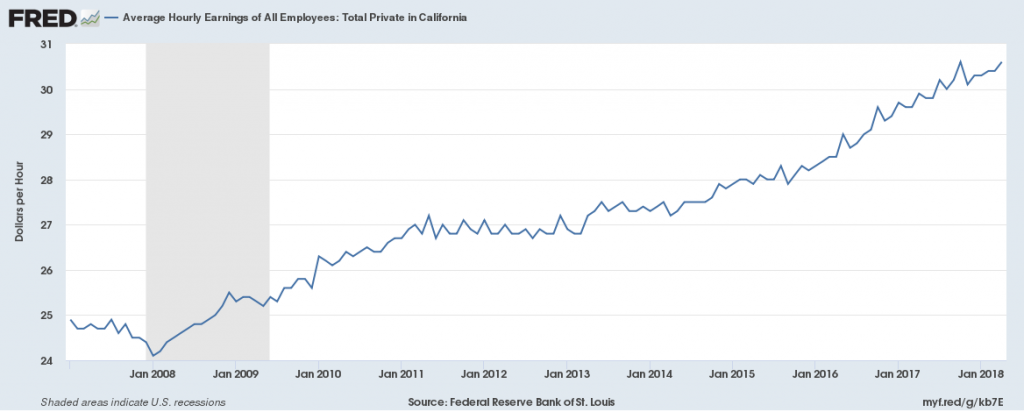
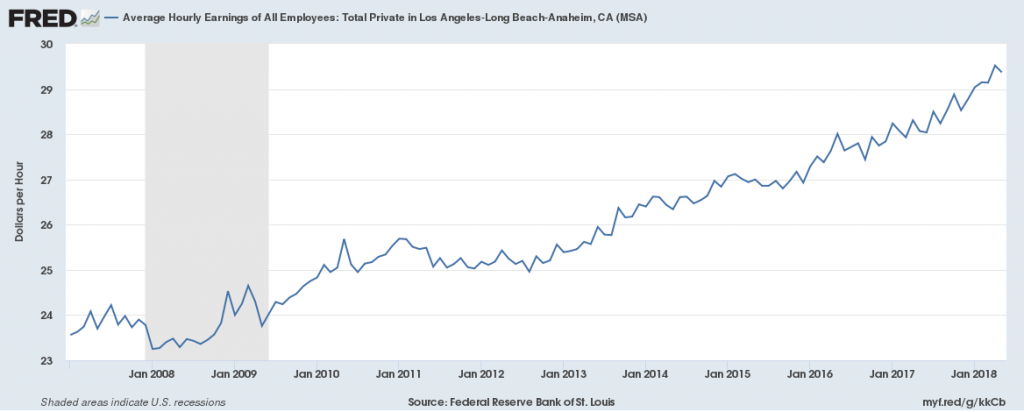
Jobs
Private-sector employers have added 2,700,000 jobs since 2010, the national low point for private-sector employment. From 2017 to 2018 the private sector added 250,000 new jobs. There were 15,000,000 total jobs in the private sector in 2018, slightly above pre-recession levels. Average hourly wages in the private sector grew from 2008-2018, going from $25/hr to $31/hr.
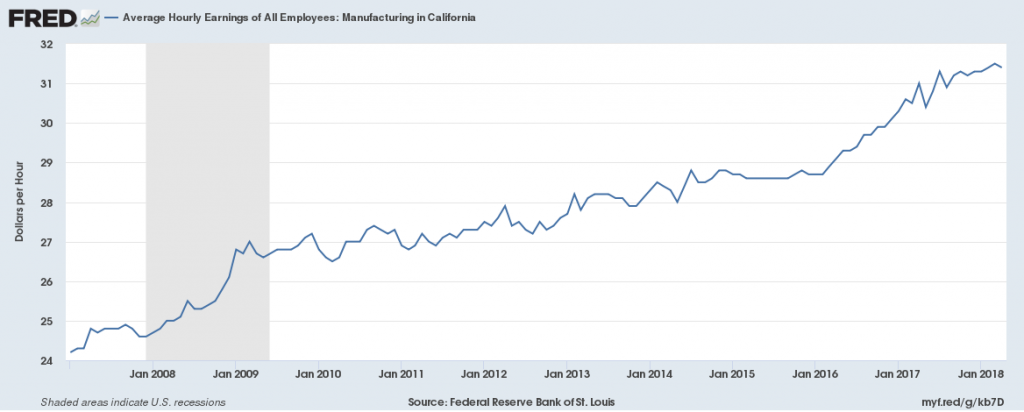
Manufacturing employment decreased since 2001, especially during the recession. There were 1,325,000 jobs in this sector in 2018, down from 1,850,000 in 2001 and below pre-recession levels of 1,450,000. Average hourly wages of manufacturing employees grew from 2008-2018, going from $25/hr to $31/hr.
There were 640,000 jobs in the Transportation, Warehousing and Utilities sector in 2018, significantly above pre-recession levels by 140,000 jobs, showing growth in this sector. The average wage in the Trade, Transportation and Utilities sector has hovered around $23/hr from 2010 to 2018.
![]()
![]()
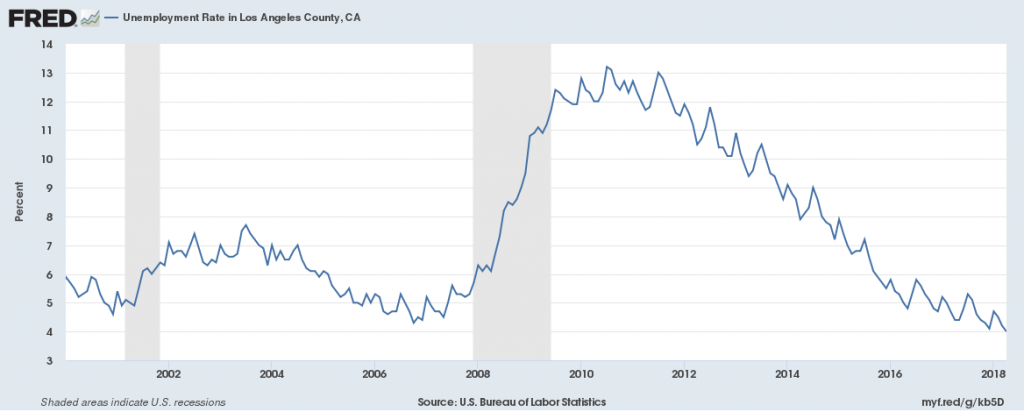
Unemployment
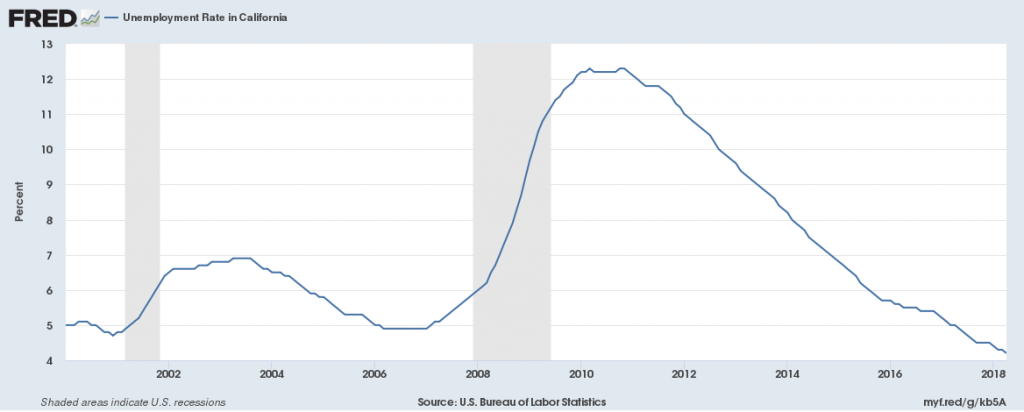
The unemployment rate in 2018 is 4.2%, down from the prior year’s 5% rate. This is above the national average of 3.9% unemployment.
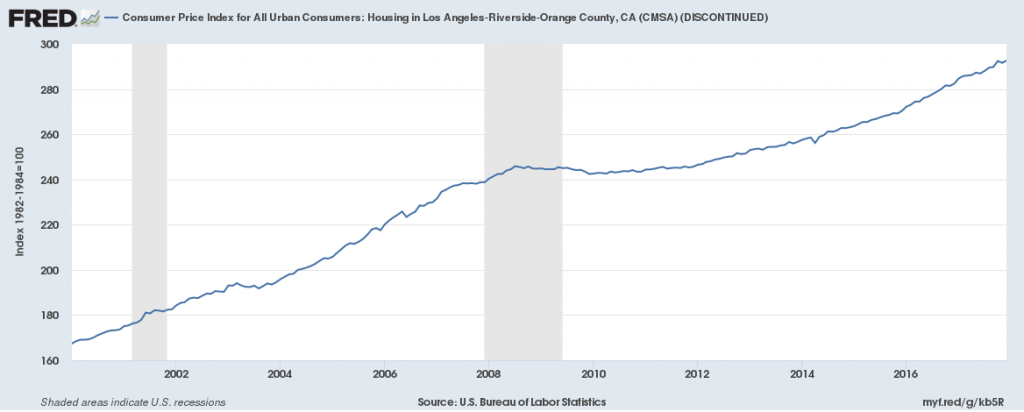
Housing
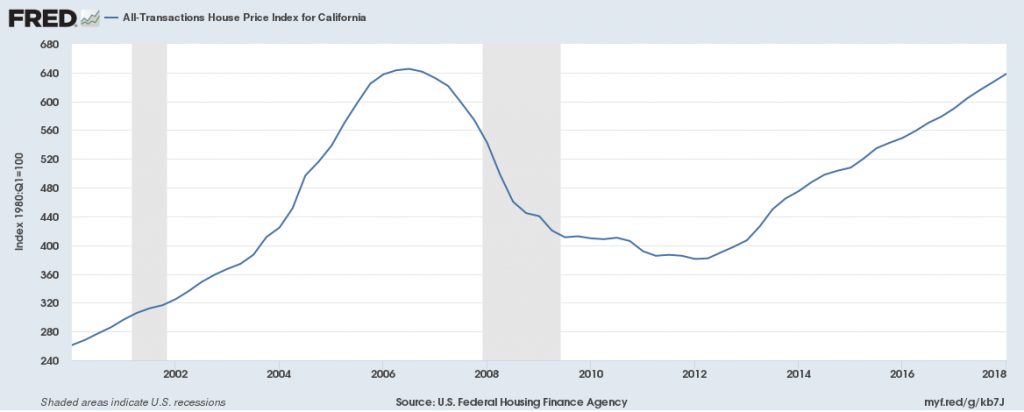
The House Price Index, a measure of the cost of housing, declined during the recession but recovered by 2018 to pre-recession levels of 640.
Los Angeles – Long Beach – Anaheim – Riverside – Orange County
Gross Domestic Product
Jobs
Private Sector
Manufacturing
Transportation, Warehousing and Utilities
![]()
Unemployment
Housing