Gross Domestic Product
Real GDP (a measure of economic growth) increased from 2009-2017, going from $638 billion to $700 billion.
Jobs
Private-sector employers have added 500,000 jobs since 2010, the national low point for private-sector employment. From 2017 to 2018 the private sector has added approximately 50,000 net new jobs for a total of 5,275,000 putting it above the 2008 pre-recession high of 5,125,000 total jobs. Average hourly wages in the private sector have grown since 2009, going from $23/hr to $27.50/hr in 2018.
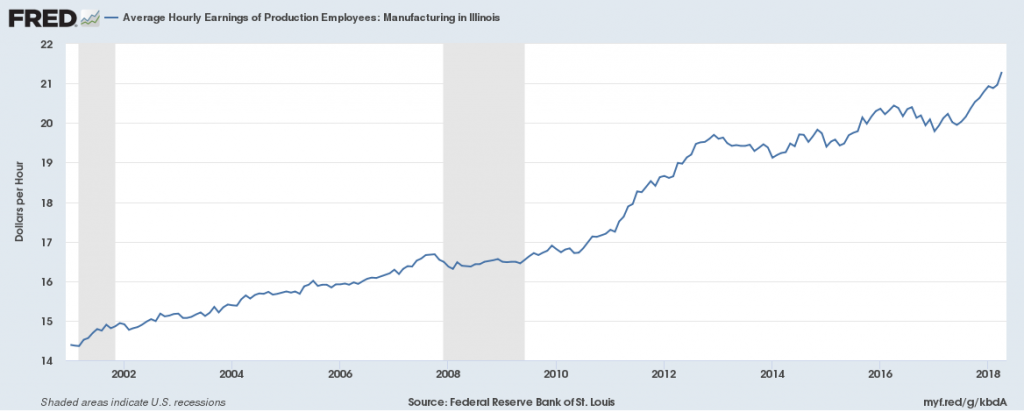
Manufacturing employment has decreased since 2000, especially during the recession. There were 590,000 jobs in this sector in 2018, down from 880,000 in 2000 and below pre-recession levels. Average hourly wages of manufacturing employees have been increasing since 2011, going from $17/hr in 2011 to $21/hr in 2018.
There were 300,000 jobs in the Transportation, Warehousing and Utilities sector in 2018, above pre-recession levels by 30,000 jobs, showing growth in this sector. The average wage in the Trade, Transportation and Utilities sector was $24/hr in 2018, up from $20/hr in 2009.
![]()
![]()
Unemployment
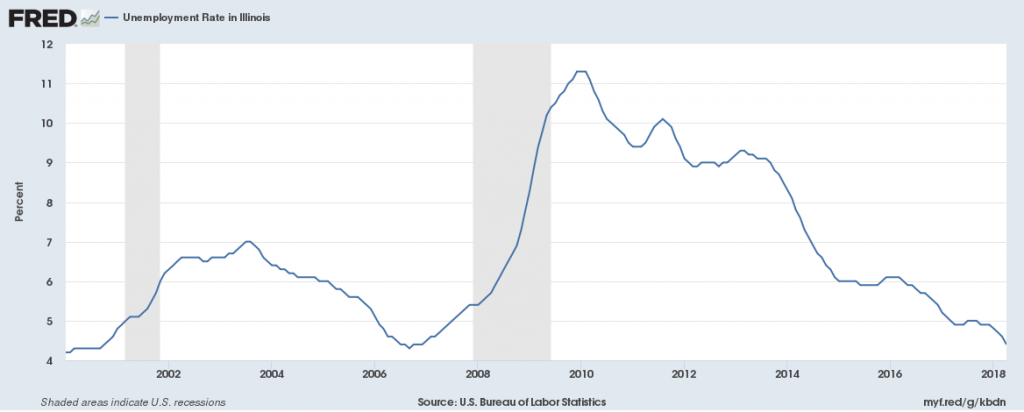
The unemployment rate in 2018 is 4.4%, down from the prior year’s 5% rate. This is above the national average of 3.9% unemployment.
Housing
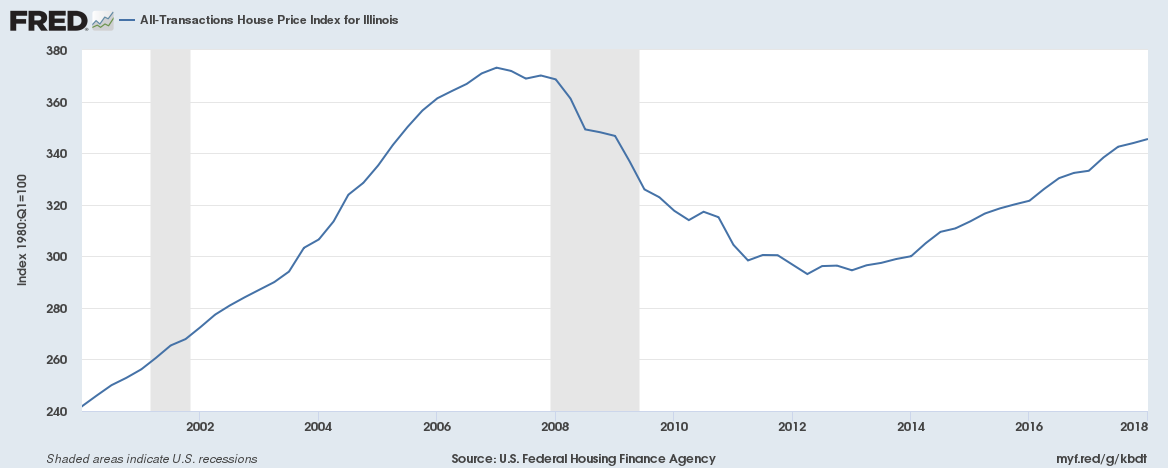
The House Price Index, a measure of the cost of housing, declined from 2008 to 2012, when it began to grow from 295 to 345 by 2018, showing increased housing costs.
Chicago-Naperville-Elgin
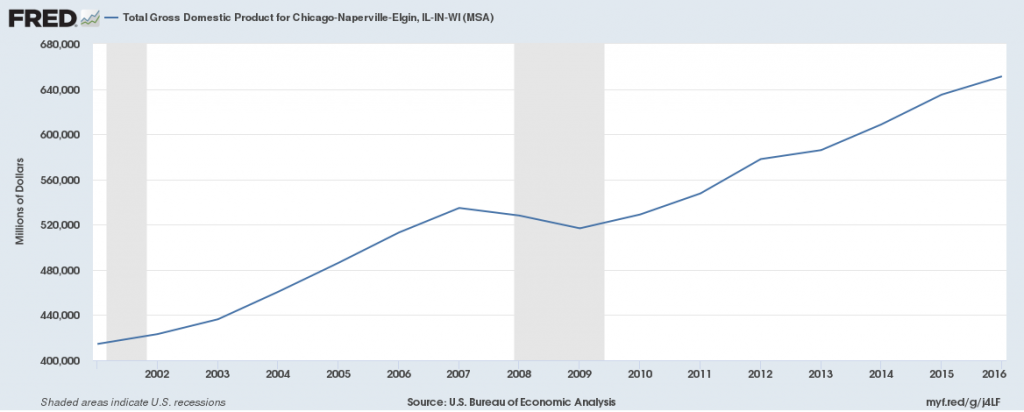
Gross Domestic Product
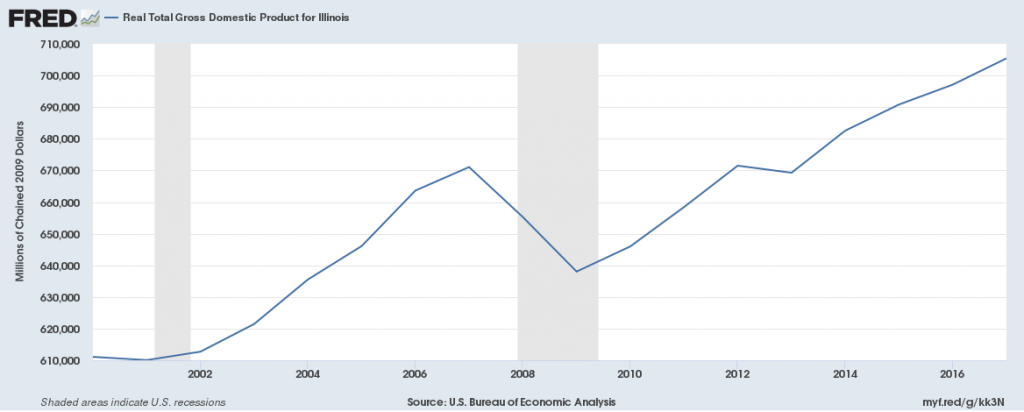
Real GDP (a measure of economic growth) increased from 2013-2016, going from $543 billion to $568 billion.
Jobs
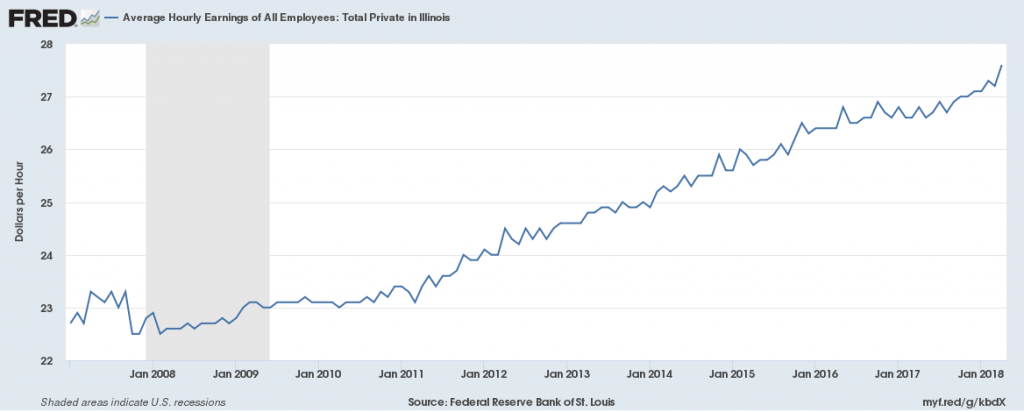
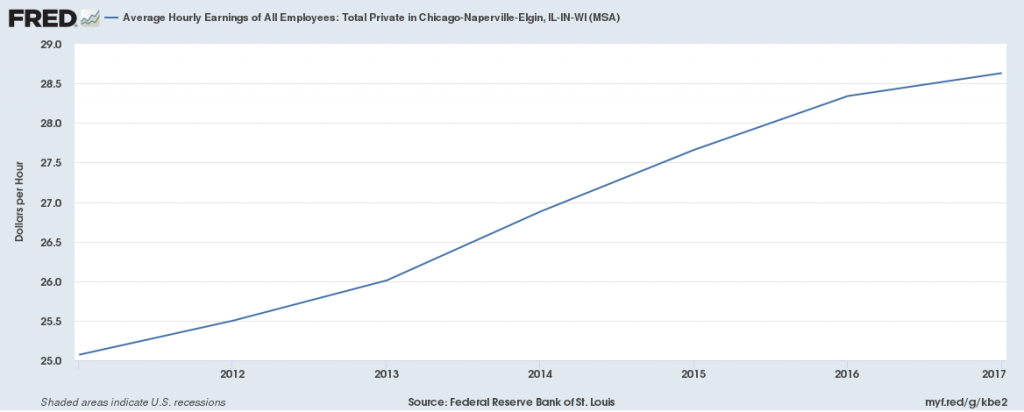
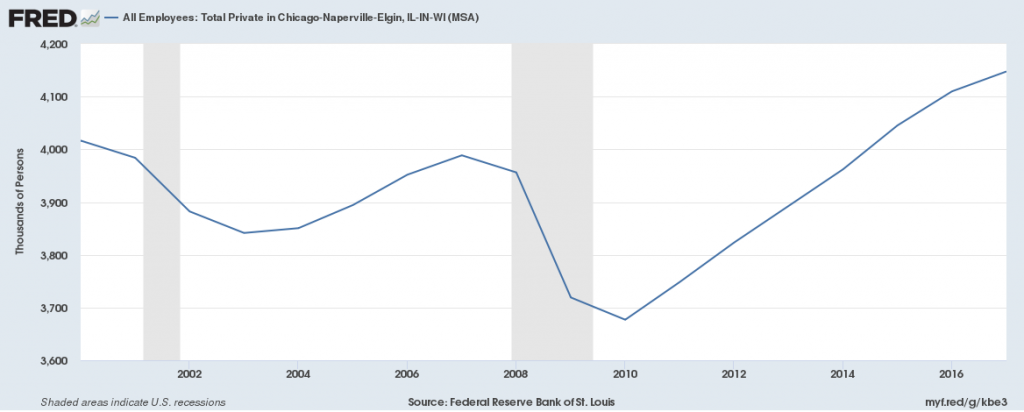
Private-sector employers have added 450,000 jobs since 2010, the national low point for private-sector employment. From 2016 to 2017 the private sector has added approximately 25,000 net new jobs for a total of 4,150,000 putting it above the 2008 pre-recession high of 3,950,000 total jobs. Average hourly wages in the private sector have grown since 2010, going from $25/hr to $28.50/hr in 2018.
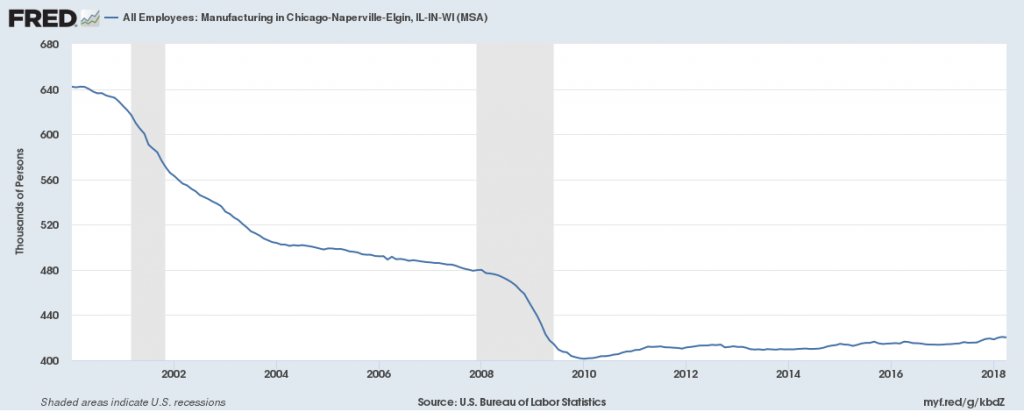
Manufacturing employment has decreased since 2000, especially during the recession. There were 420,000 jobs in this sector in 2018, down from 640,000 in 2000 and below pre-recession levels. Average hourly wages of manufacturing employees were $17.96/hr in 2018.
There were 240,000 jobs in the Transportation, Warehousing and Utilities sector in 2018, above pre-recession levels by 35,000 jobs, showing growth in this sector. The average wage in the Trade, Transportation and Utilities sector was $18.75/hr in 2018.
![]()
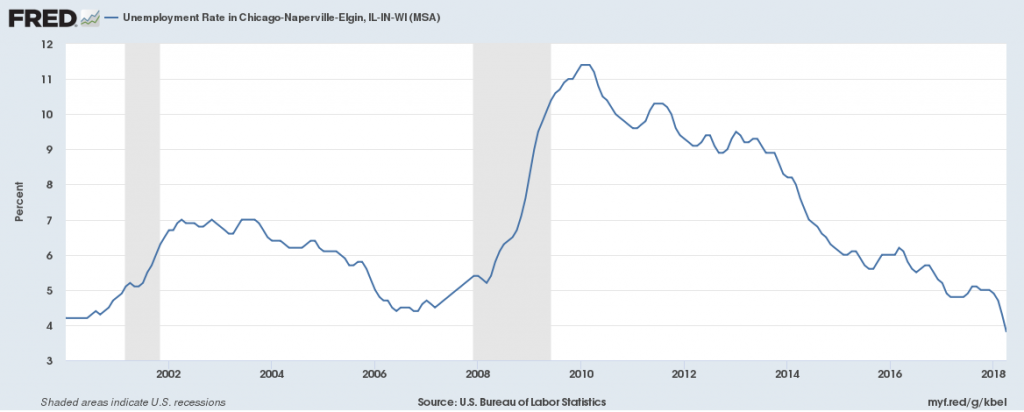
Unemployment
The unemployment rate in 2018 is 3.9%, down from the prior year’s 5% rate. This is the same as the national average of 3.9% unemployment.
Housing
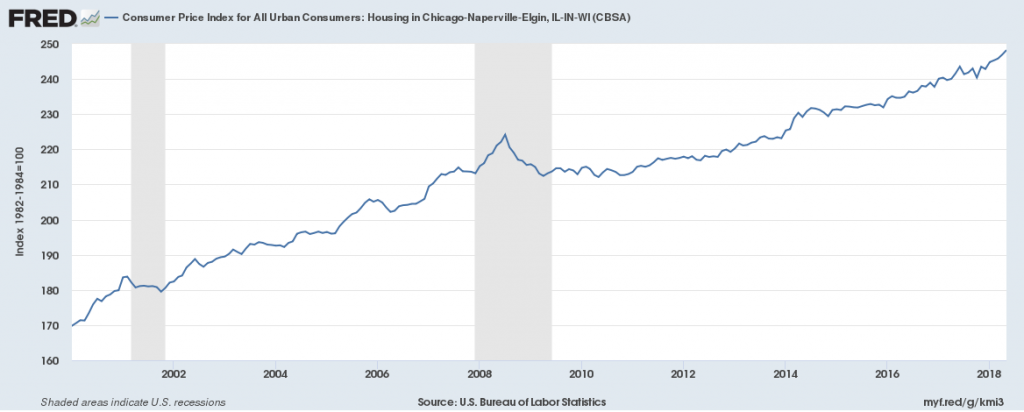
The Consumer Price Index has increased consistently since 2000 showing an increase in the cost of living in the area from 170 to 240.