Gross Domestic Product
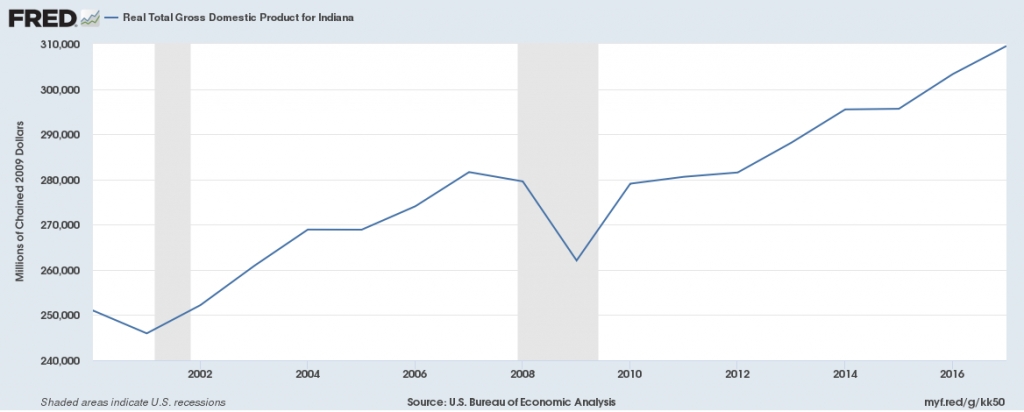
Real GDP (a measure of economic growth) increased from 2009-2017, going from $517 billion to $569 billion.
Jobs
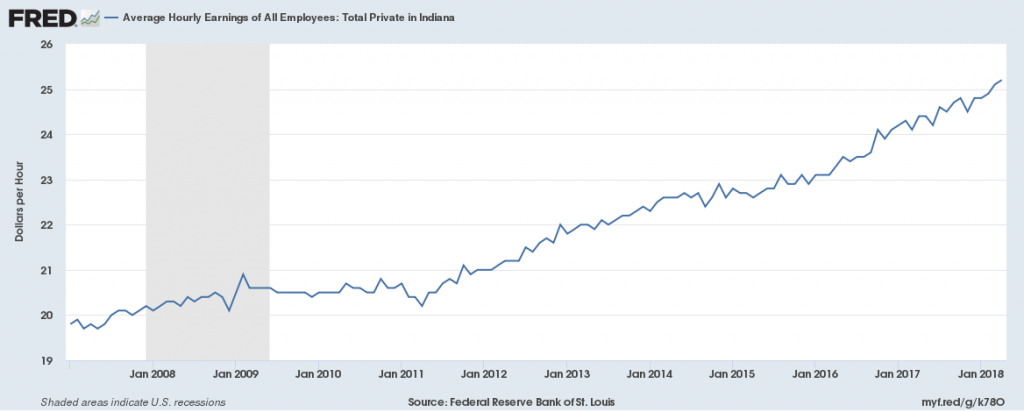
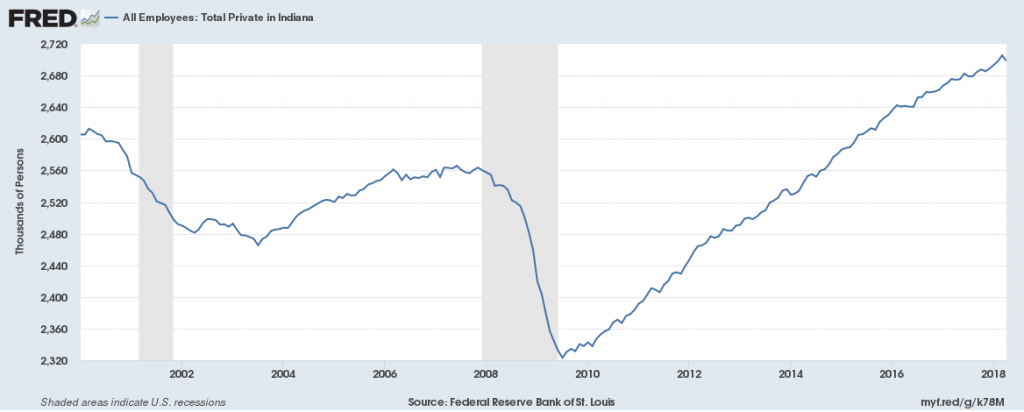
Private-sector employers have added 380,000 jobs since 2010, the national low point for private-sector employment. From 2017 to 2018 the private sector has added approximately 20,000 net new jobs for a total of 2,700,000 putting it above the 2008 pre-recession high of 2,560,000 total jobs. Average hourly wages in the private sector have grown since 2011, going from $20.50/hr to $25/hr in 2018.
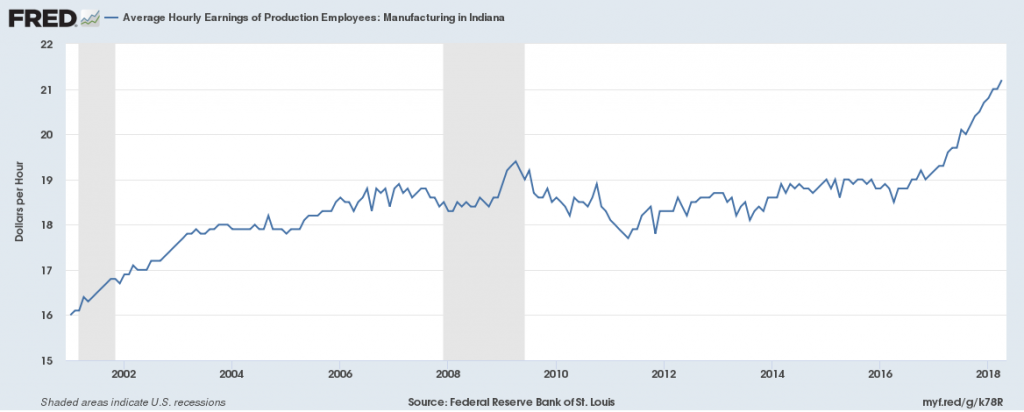
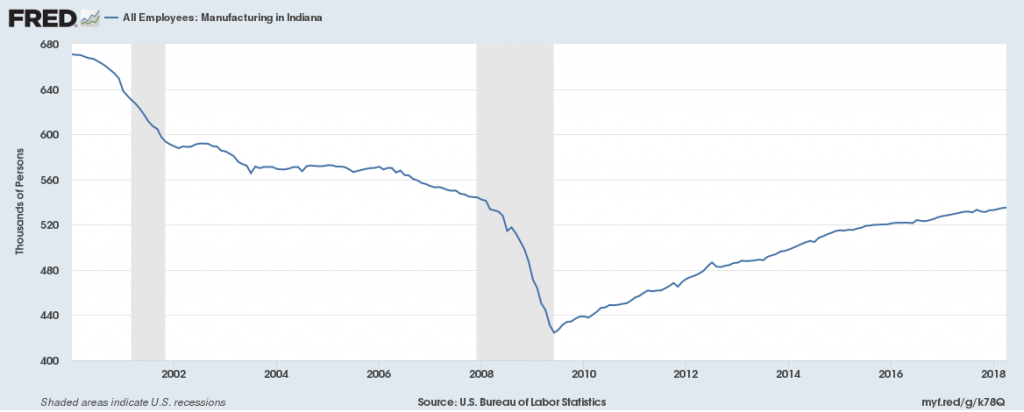
Manufacturing employment has decreased since 2000, especially during the recession. There were 535,000 jobs in this sector in 2018, down from 670,000 in 2000 and below pre-recession levels. Average hourly wages of manufacturing employees have been increasing since 2016, going from $19/hr in 2011 to $21/hr in 2018.
There were 133,000 jobs in the Transportation and Warehousing sector in 2018, above pre-recession levels by 13,000 jobs, showing growth in this sector. The average wage in the Trade, Transportation and Utilities sector was $22.25/hr in 2018, up from $17.25/hr in 2008.
![]()
![]()
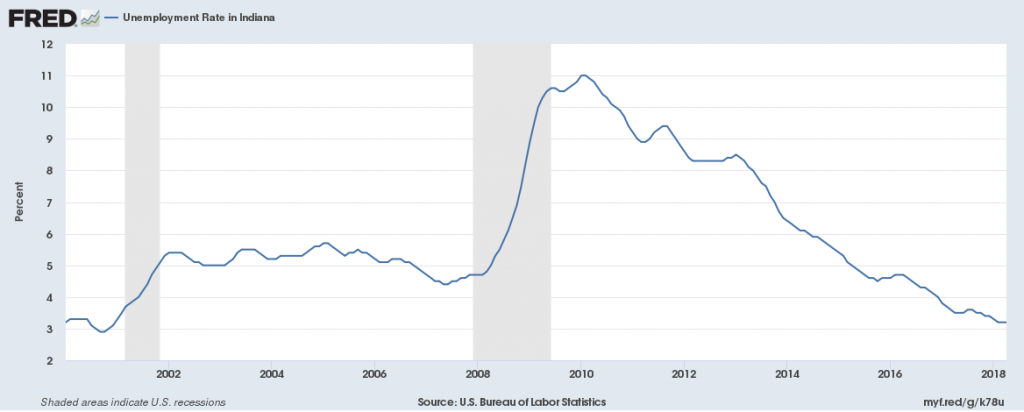
Unemployment
The unemployment rate in 2018 is 3.2%, down from the prior year’s 3.6% rate. This is below the national average of 3.9% unemployment.
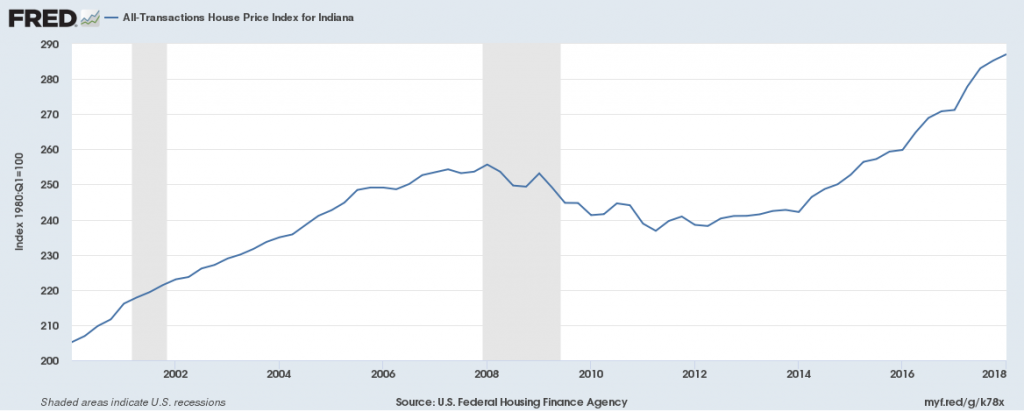
Housing
The House Price Index, a measure of the cost of housing, declined from 2008 to 2012, until it began to grow from 240 to 285 by 2018, showing increased housing costs.
Indianapolis-Carmel-Anderson
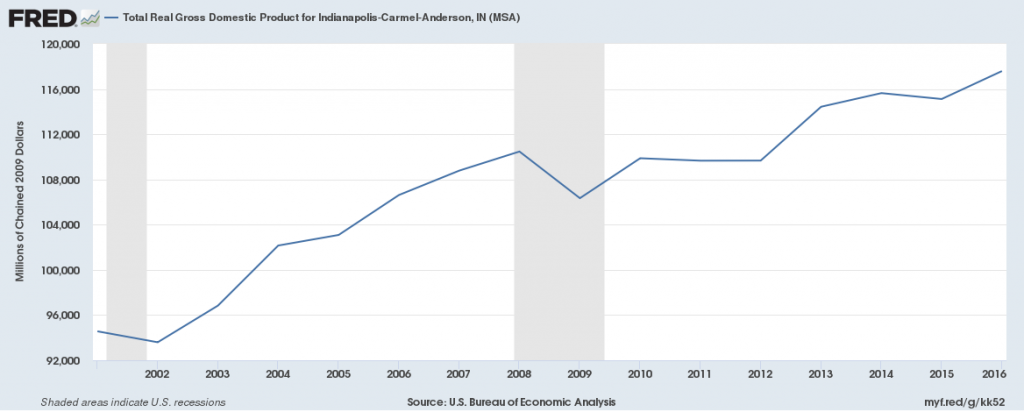
Gross Domestic Product
Real GDP (a measure of economic growth) increased from 2009-2017, going from $106 billion to $118 billion.
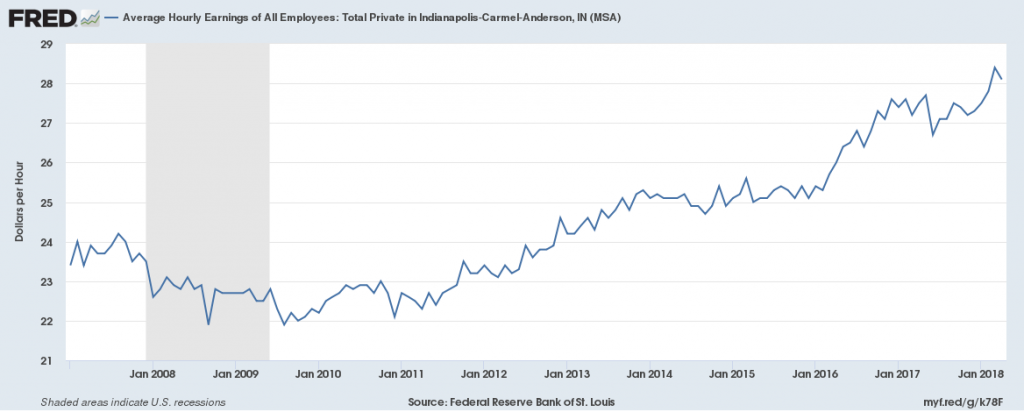
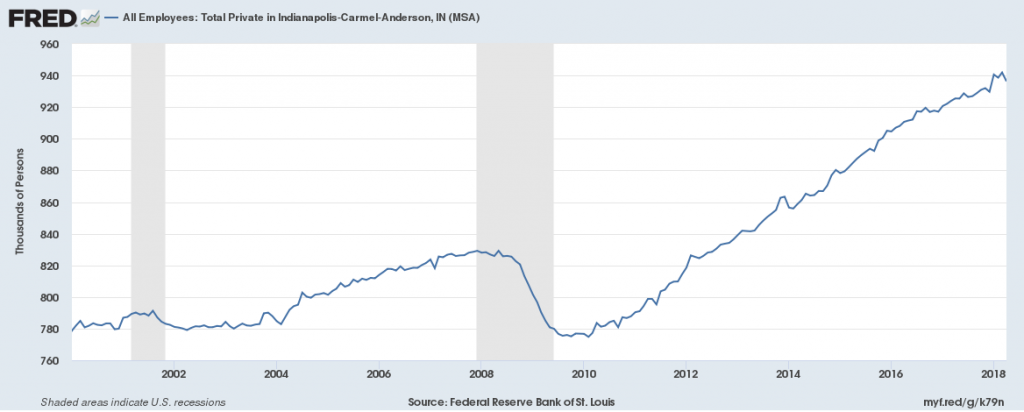
Jobs
Private-sector employers have added 160,000 jobs since 2010, the national low point for private-sector employment. From 2017 to 2018 the private sector has added approximately 20,000 net new jobs for a total of 940,000 putting it above the 2008 pre-recession high of 830,000 total jobs. Average hourly wages in the private sector have grown since 2011, going from $22.50/hr to $28/hr in 2018.
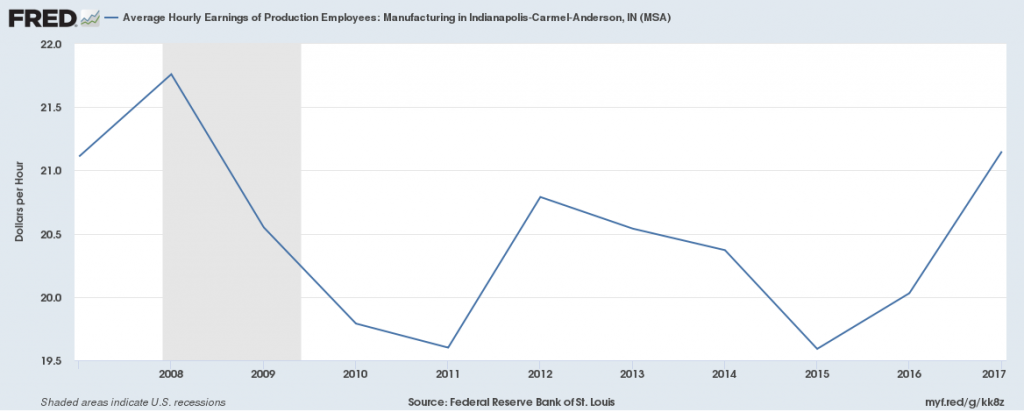
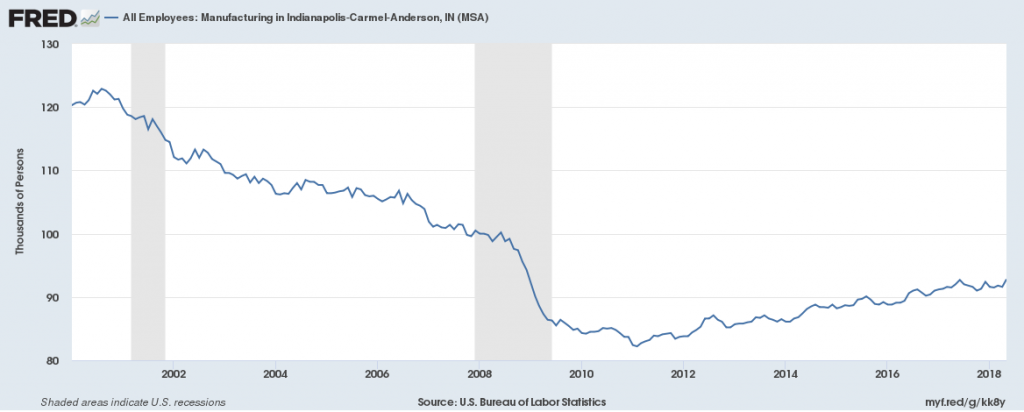
Manufacturing employment has decreased since 2000, especially during the recession. There were 92,000 jobs in this sector in 2018, down from 122,000 in 2000 and below pre-recession levels. Average hourly wages of manufacturing employees have fluctuated around $21/hr since 2010 and are currently on average $21.50/hr in 2018.
There were 61,000 jobs in the Transportation and Warehousing sector in 2018, above pre-recession levels by 10,000 jobs, showing growth in this sector. The average wage in Material Moving Occupations was $16.84/hr in 2018.
![]()
Unemployment
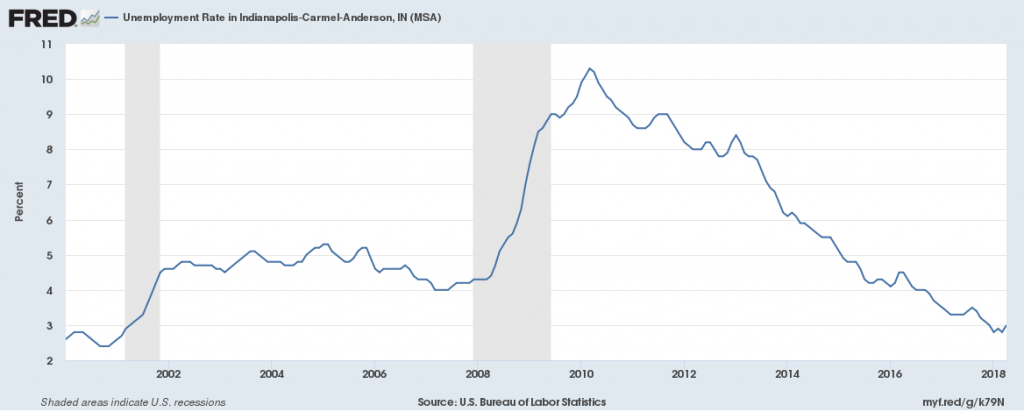
The unemployment rate in 2018 is 3%, down from the prior year’s 3.5% rate. This is below the national average of 3.9% unemployment.
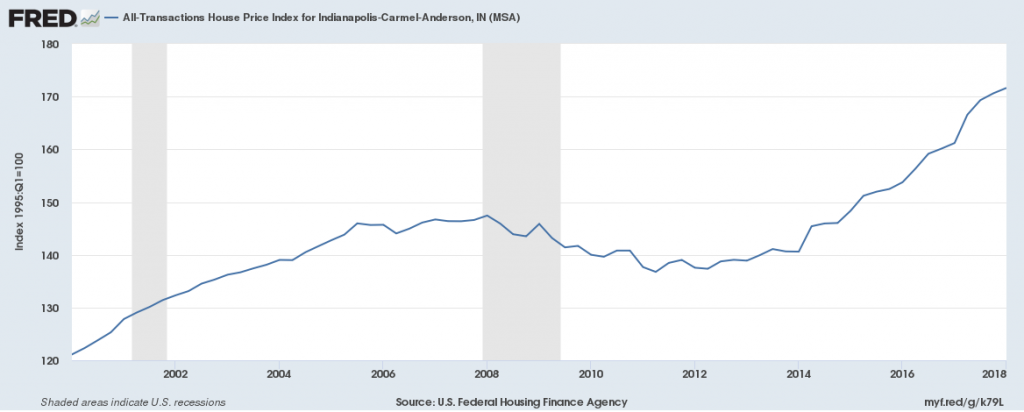
Housing
The House Price Index, a measure of the cost of housing, declined from 2008 to 2012, until it began to grow significantly till 2018, showing increased housing costs.