Gross Domestic Product
Real GDP (a measure of economic growth) increased from 2009-2016, going from $258 billion to $305 billion.
Jobs
Private-sector employers have added 300,000 jobs since 2010, the national low point for private-sector employment. From 2017 to 2018 the private sector has added approximately 30,000 net new jobs for a total of 2,700,000 putting it above the 2008 pre-recession high of 2,525,000 total jobs. Average hourly wages in the private sector have grown since 2009, going from $23/hr to $28.75/hr in 2018.
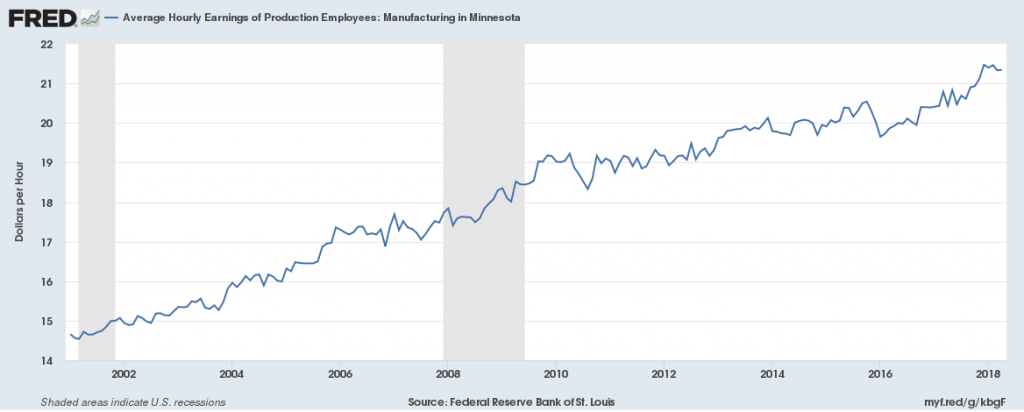
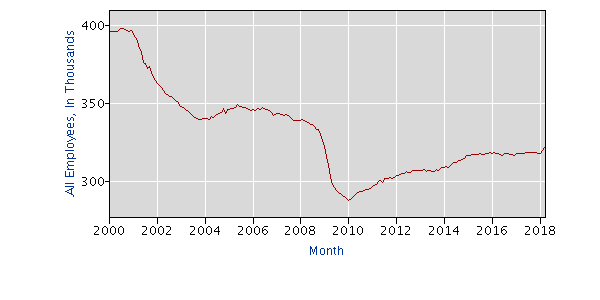
Manufacturing employment has decreased since 2000, especially during the recession. There were 320,000 jobs in this sector in 2018, down from 395,000 in 2000 and below pre-recession levels. Average hourly wages of manufacturing employees have grown since 2000, going from $14.75/hr to $21.25/hr by 2018.
There were 108,000 jobs in the Transportation, Warehousing and Utilities sector in 2018, above pre-recession levels by 13,000 jobs, showing growth in this sector. The average wage in the Transportation and Warehousing sector has been growing since 2006, going from $14 to $22/hr by 2018.
![]()
![]()
Unemployment
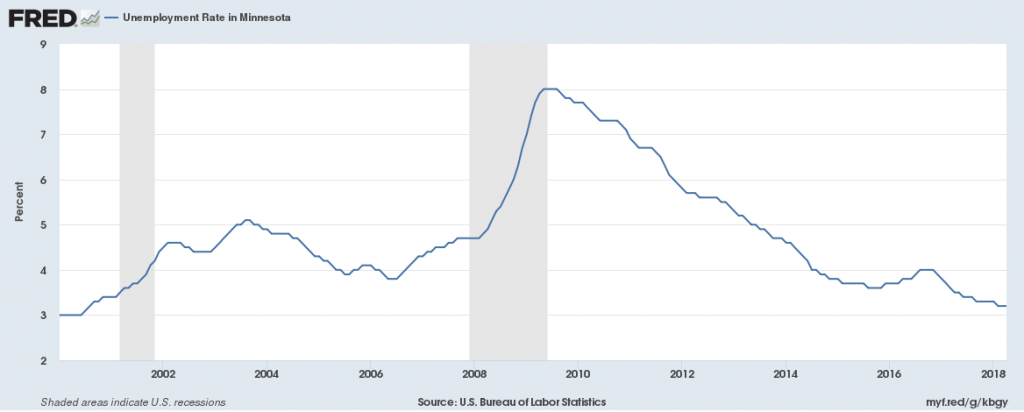
The unemployment rate in 2018 is 2.9%, down from the prior year’s 3.25% rate. This is below the national average of 3.9% unemployment.
Housing
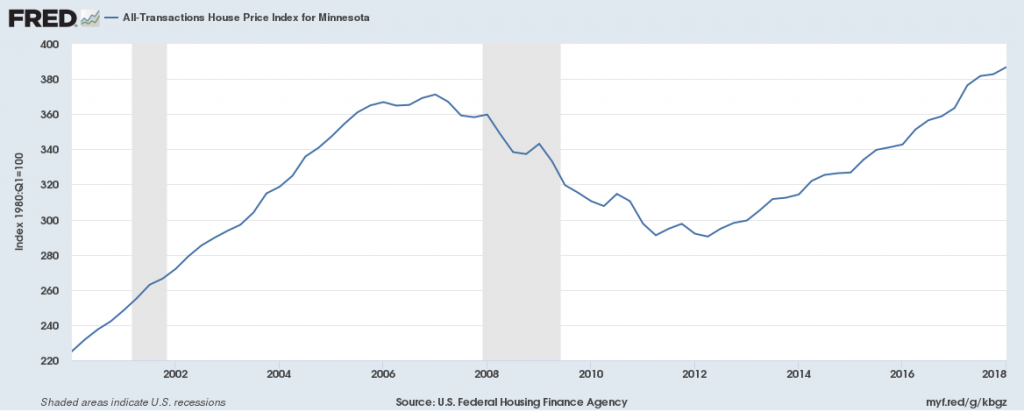
The House Price Index, a measure of the cost of housing, declined from 2007 to 2012, until it began to grow till 2018, going from 290 to 385, showing increasing housing costs above pre-recession levels.
Minneapolis-St. Paul-Bloomington
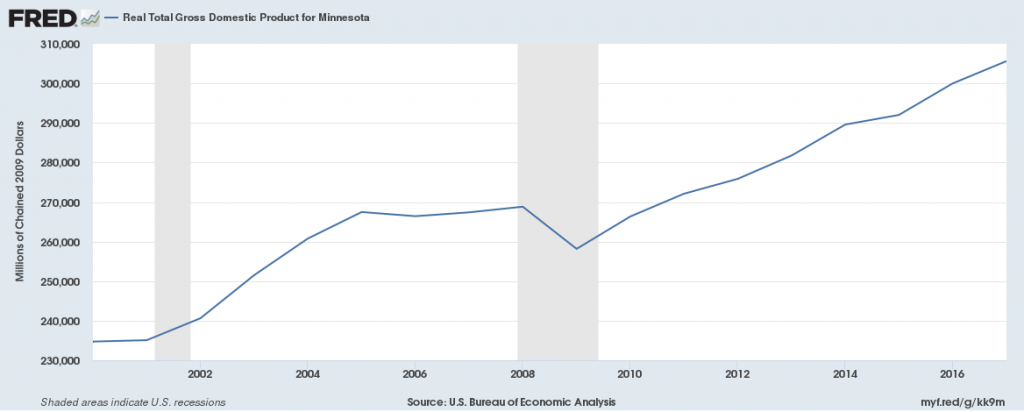
Gross Domestic Product
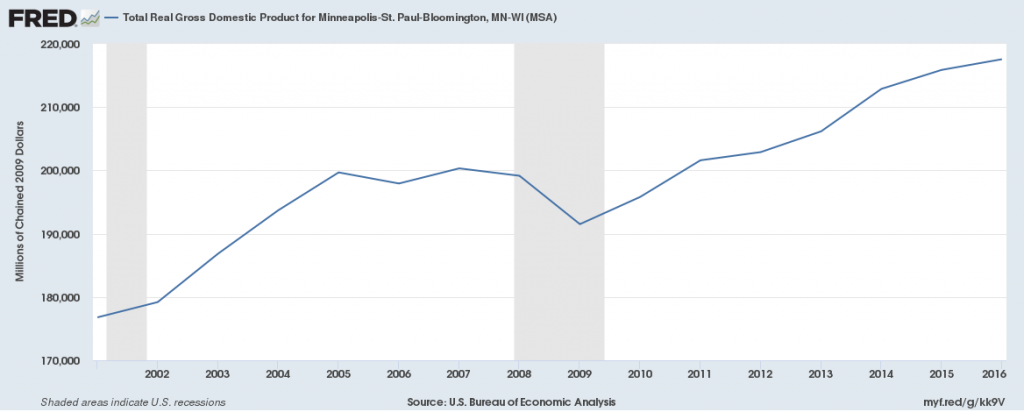
Real GDP (a measure of economic growth) increased from 2009-2016, going from $192 billion to $216 billion.
Jobs
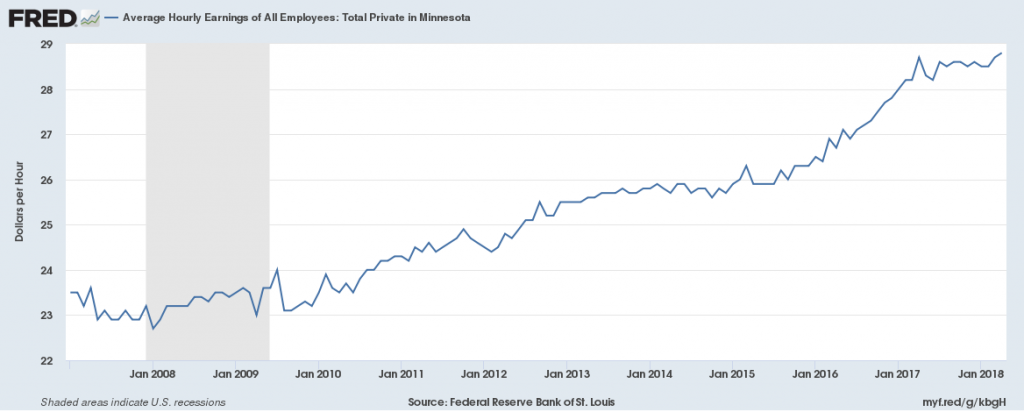
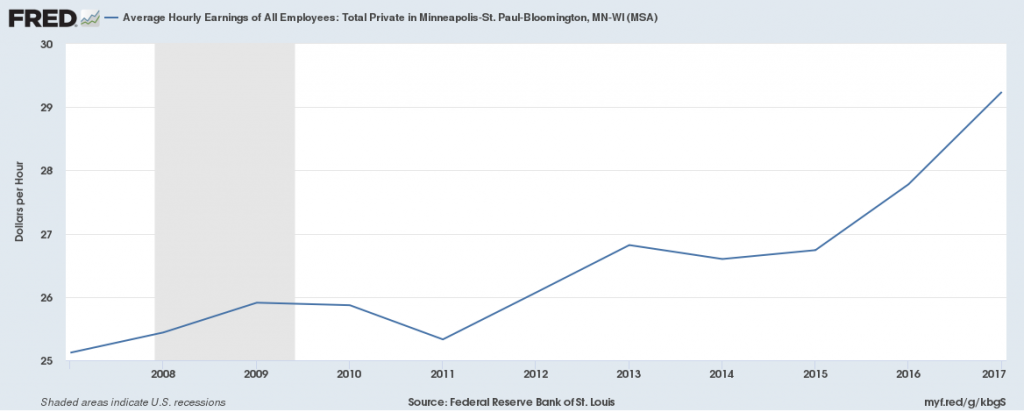
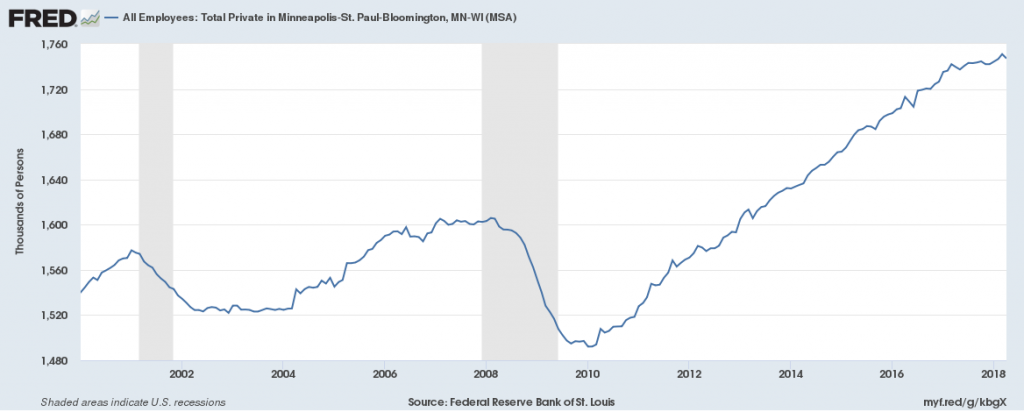
Private-sector employers have added 250,000 jobs since 2010, the national low point for private-sector employment. From 2017 to 2018 the private sector has added approximately 35,000 net new jobs for a total of 1,750,000 putting it above the 2008 pre-recession high of 1,600,000 total jobs. Average hourly wages in the private sector have grown since 2011, going from $25.33/hr to $29/hr in 2017.
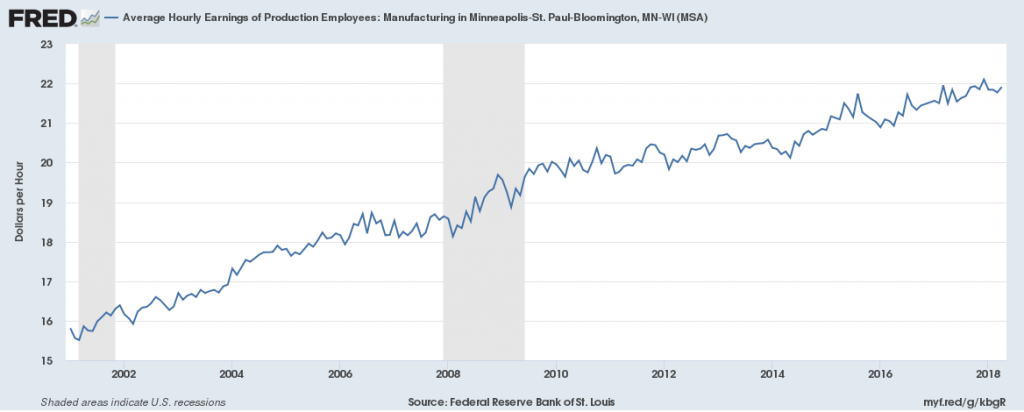
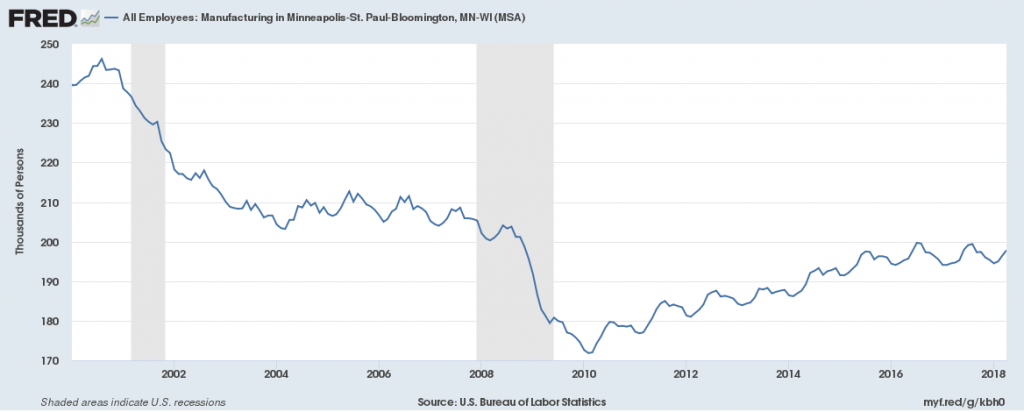
Manufacturing employment has decreased since 2000, especially during the recession. There were 200,000 jobs in this sector in 2018, down from 240,000 in 2000 and below pre-recession levels. Average hourly wages of manufacturing employees have grown since 2000, going from $16/hr to $22/hr by 2018.
There were 69,000 jobs in the Transportation, Warehousing and Utilities sector in 2018, above pre-recession levels by 9,000 jobs, showing growth in this sector. The average wage in the Transportation and Warehousing sector has grown from 2009-2011 and 2014-2018, going from $17/hr in 2002 to $22/hr by 2018.
![]()
![]()
Unemployment
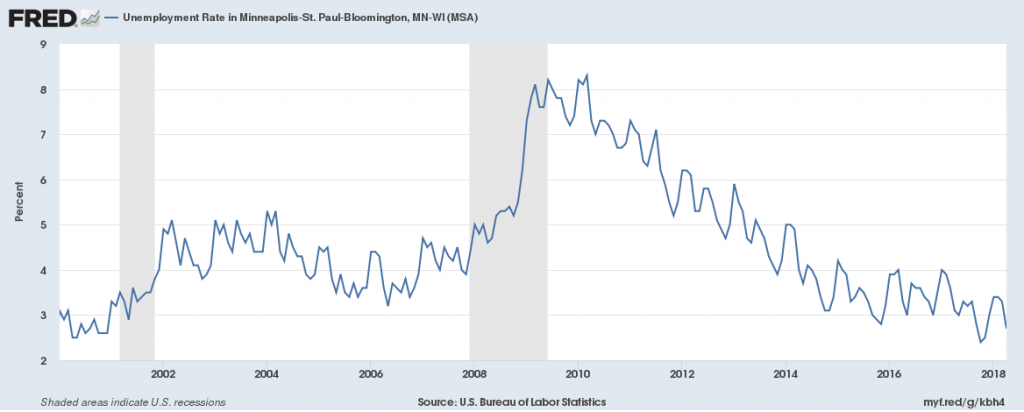
The unemployment rate in 2018 is 3%, down from the prior year’s 4% rate. This is below the national average of 3.9% unemployment.
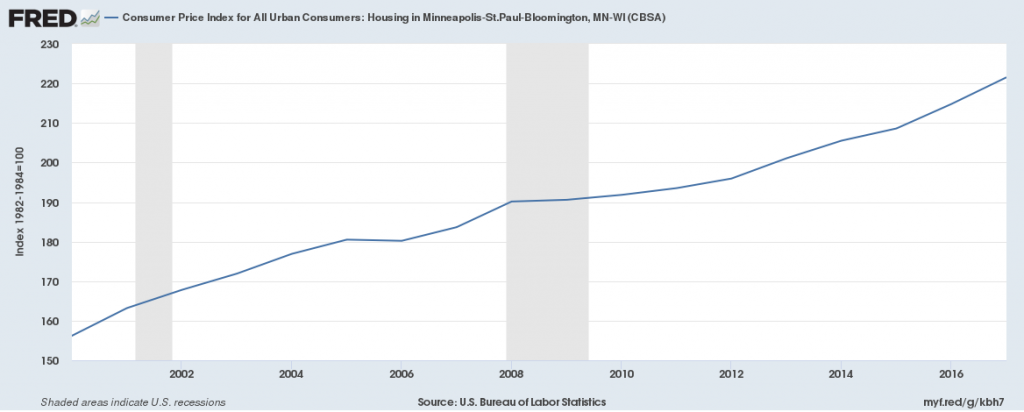
Housing
The Consumer Price Index for Housing has increased consistently since 2000, rising from 155 to 220 from 2000-2018, showing increasing housing costs.