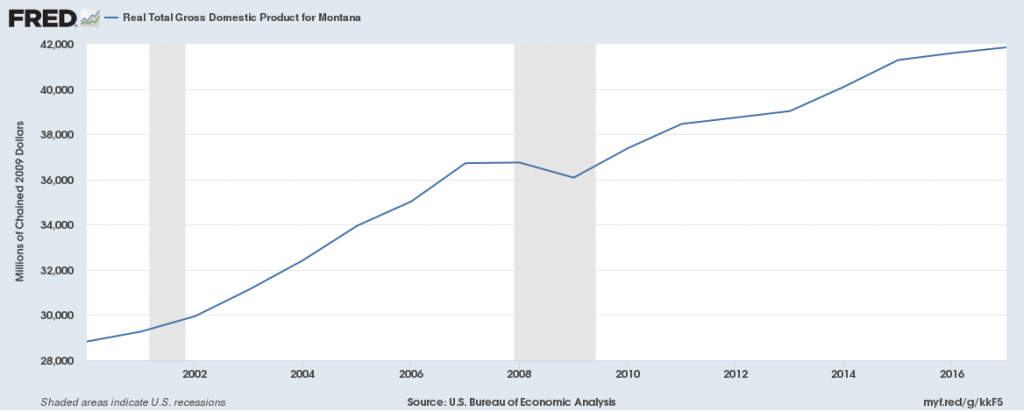
Gross Domestic Product
Real GDP (a measure of economic growth) increased from 2005-2007 and resumed growth from 2009-2017, going from $36 billion in 2009 to $42 billion in 2017.
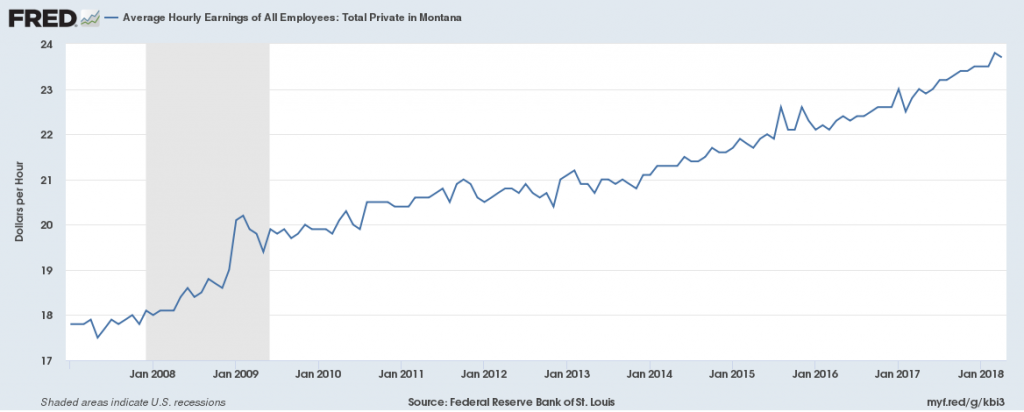
Jobs
Private-sector employers have added 50,000 jobs since 2010, the national low point for private-sector employment. From 2017 to 2018 the private sector added 7,000 new jobs. There were 380,000 total jobs in the private sector in 2017, above pre-recession levels of 360,000. Average hourly wages in the private sector grew from 2009-2018, going from $20/hr to $23.75/hr.
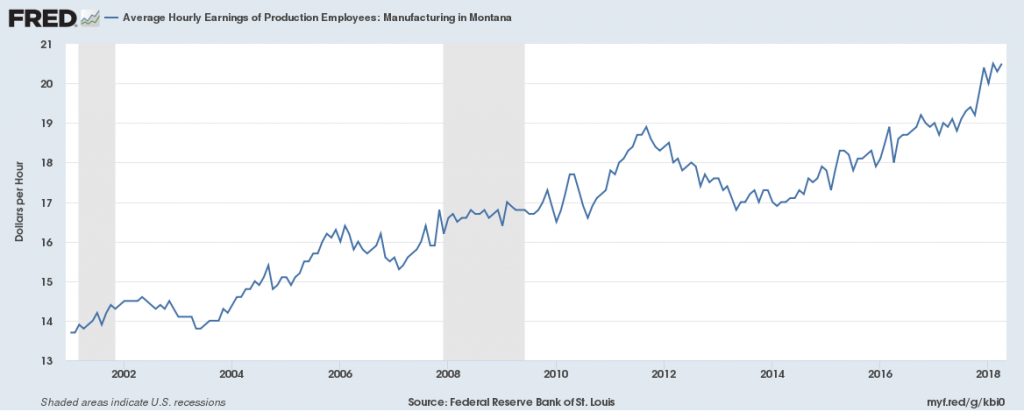
Manufacturing employment decreased since 2001, especially during the recession, but has exceeded 2008 levels by 2018. There were 20,000 jobs in this sector in 2018, the same as in 2008, but below 2000 levels of 22,500 jobs. Average hourly wages of manufacturing employees increased from 2002-2012 and from 2014-2018, going from $17/hr in 2014 to $20.50/hr in 2018.
There were 18,000 jobs in the Trade, Transportation and Utilities sector in 2018, above pre-recession levels by 2,000 jobs, showing mild growth in this sector. The average wage in Trade, Transportation and Utilities occupations was $15/hr in 2008 and grew to $21/hr by 2018.
![]()
![]()
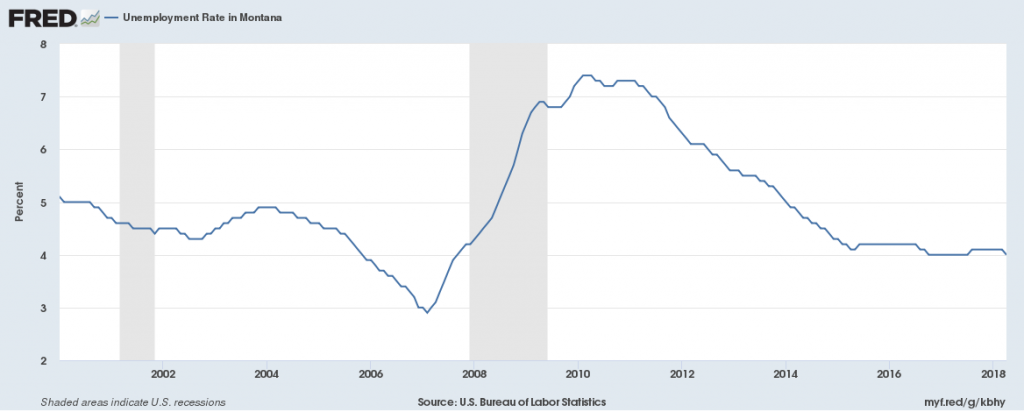
Unemployment
The unemployment rate in 2018 is 4%, the same as 2017. This is slightly above the national average of 3.9% unemployment.
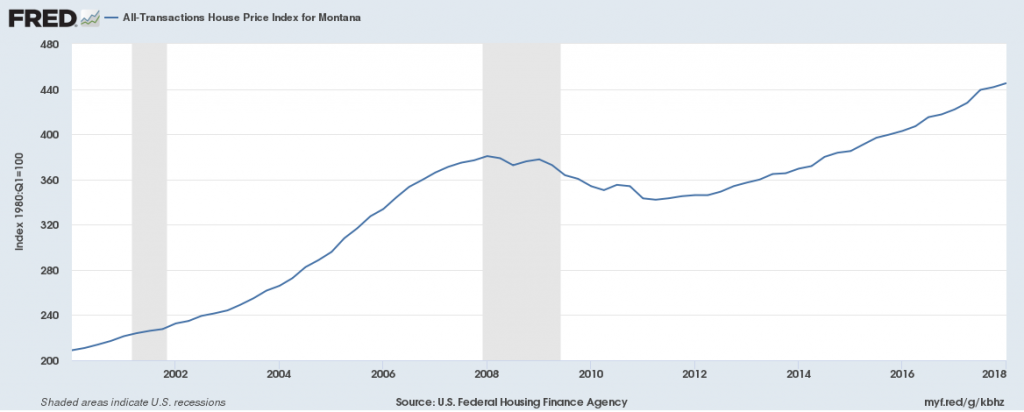
Housing
The House Price Index, a measure of the cost of housing, from 2008-2012 but has exceeded pre-recession highs, going from a low of 335 in 2012 to a high of 445 in 2018, showing increased housing costs.