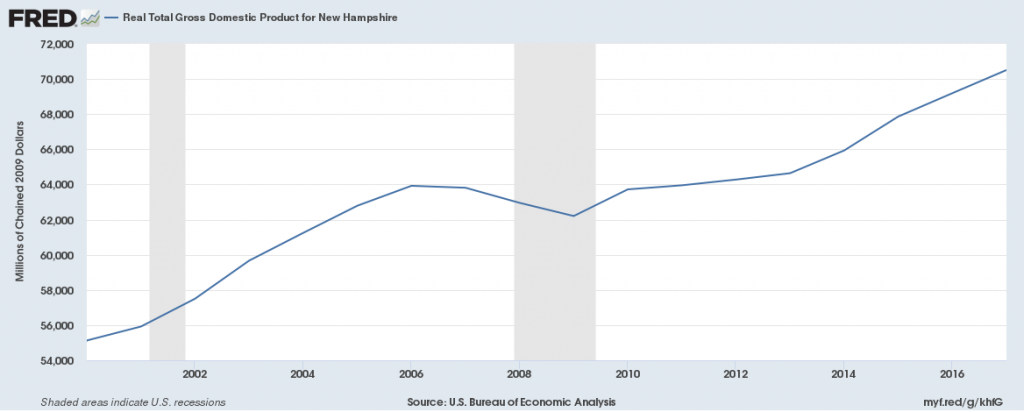
Gross Domestic Product
Real GDP (a measure of economic growth) has increased from $55 billion since 2000 to a high of $70 billion in 2018.
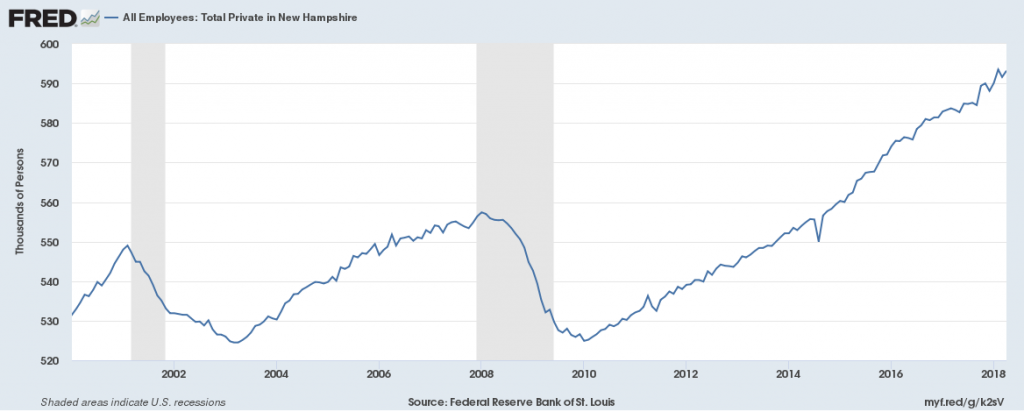
Jobs
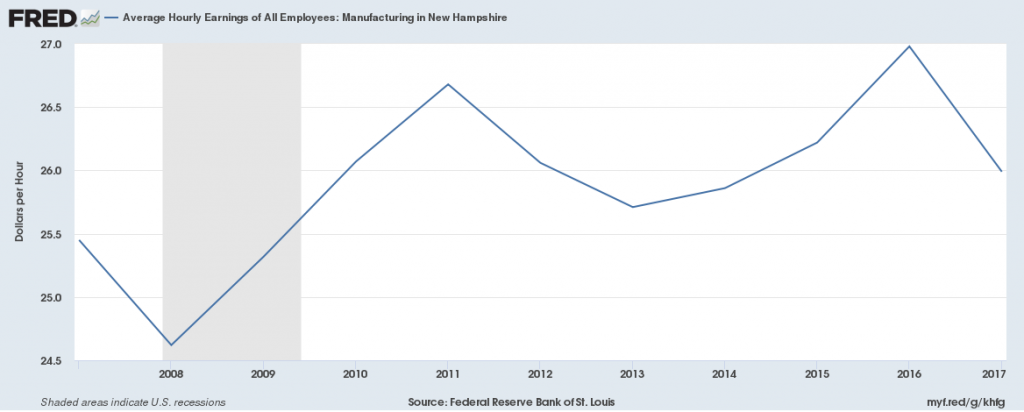
New Hampshire Private-sector employers have added jobs (an increase of 5.4 percent) since February 2010. From 2017 to 2018, the New Hampshire private sector has added 69,000 jobs. Average hourly wages have increased since 2008, going from $22/hr to $26.5/hr.
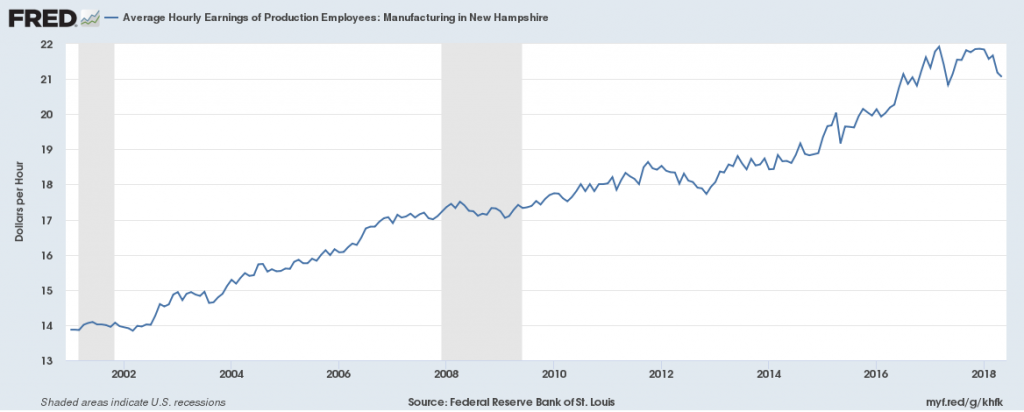
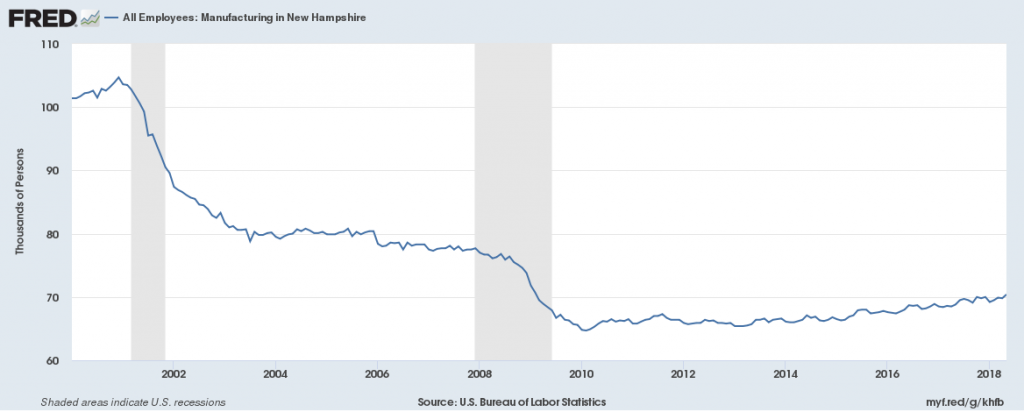
Manufacturing employment has declined steadily since 2002, especially during the 2008 recession. There are currently 70,000 jobs in this sector in 2018, down from 102,000 in 2000. Average hourly wages of production employees have been increasing steadily, up from $17/hr in 2010 to $21/hr in 2018.
Transportation and Warehousing employment has increased since 2010, going from a low of approximately 11,500 workers in 2010 to 14,800 workers in 2017. The average wage in the Transportation, Trade and Utilities sector was $23.25/hr in 2018.
![]()
![]()
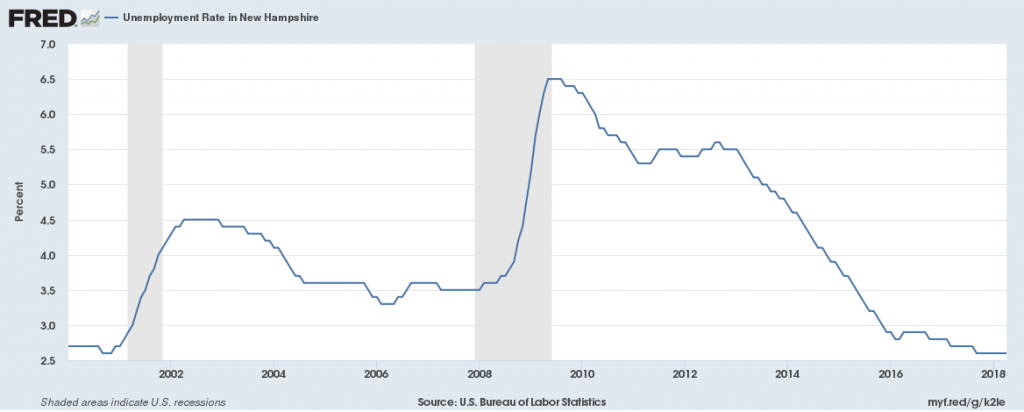
Unemployment
The unemployment rate in New Hampshire was 2.6% 2018, around .2% points lower than the year before. The rate is below the national average of 3.9%.
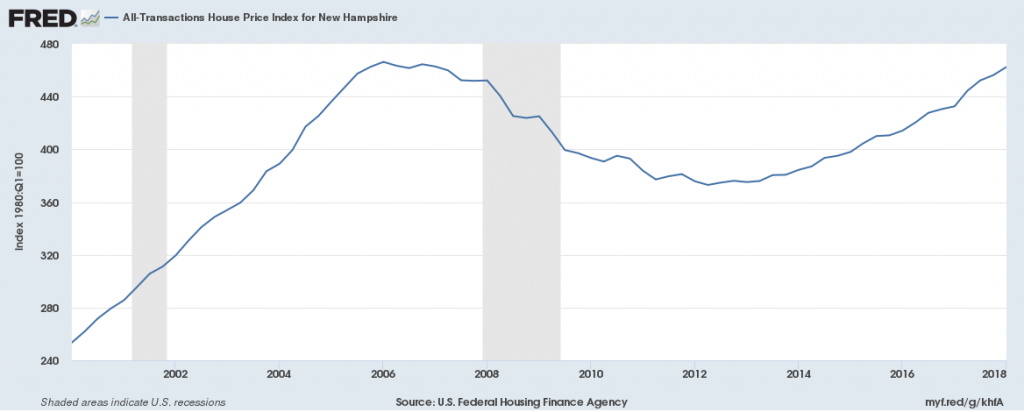
Housing
The House Price Index, a measure of the cost of housing, declined from a 2006 high until 2012 when it slowly began to recover. As of 2018, it has returned to the 2006 peak of 460, showing increasing housing costs.
Home prices in New Hampshire increased by 4.6 percent from the second quarter of 2013 to the second quarter of 2014. They are up 5.7 percent since their recent low in the second quarter of 2012 but remain 15.1 percent below their pre-housing-crash peak.