Gross Domestic Product
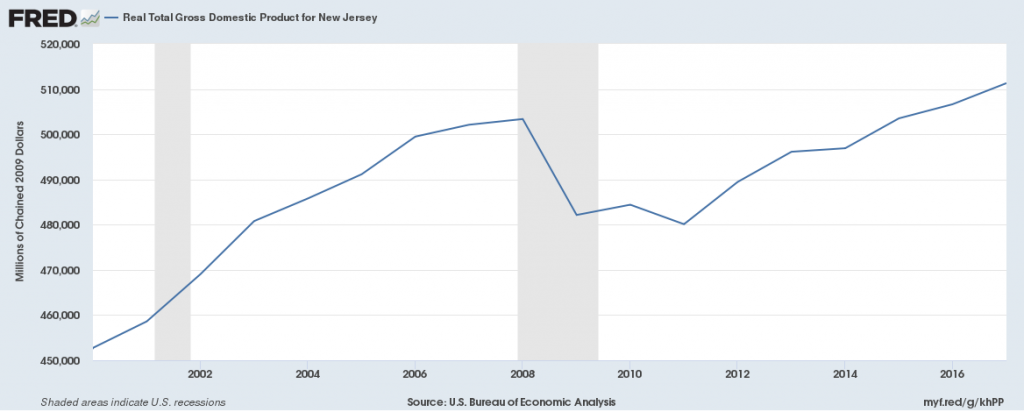
Real GDP (a measure of economic growth) has been steadily increasing since 2011, hitting a peak of $510 billion in 2017, exceeding the 2007 peak of $504 billion.
Jobs
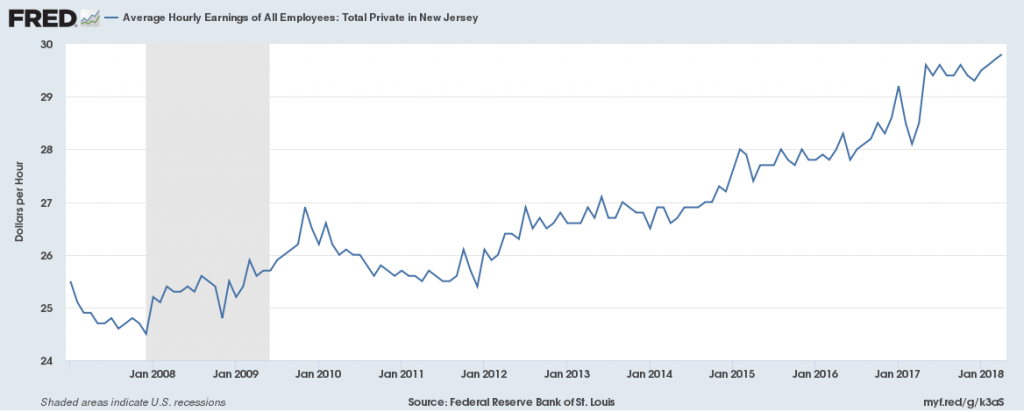
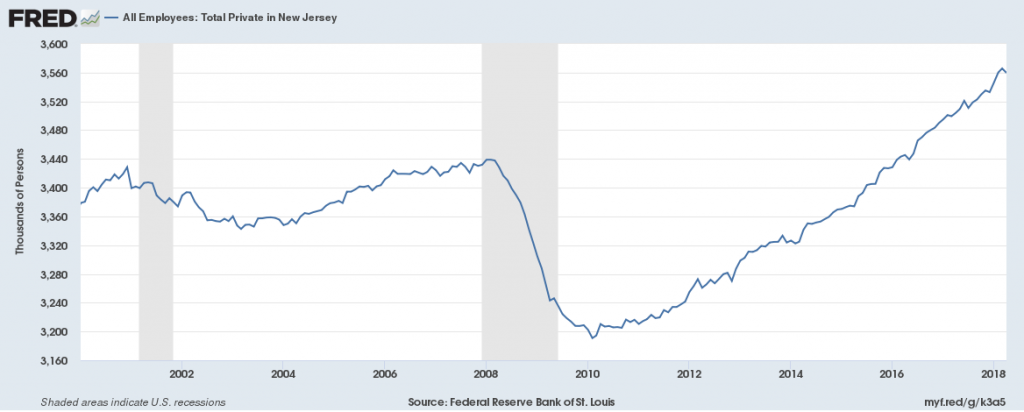
Private-sector employers have added 370,000 jobs since February 2010, the national low point for private-sector employment and 160,000 more jobs than before the recession. From 2017 to 2018 the private sector has added approximately 40,000 net new jobs. Average hourly wages in the private sector have been slowly increasing since 2008, going from $24.50/hr to $30/hr in 2018.
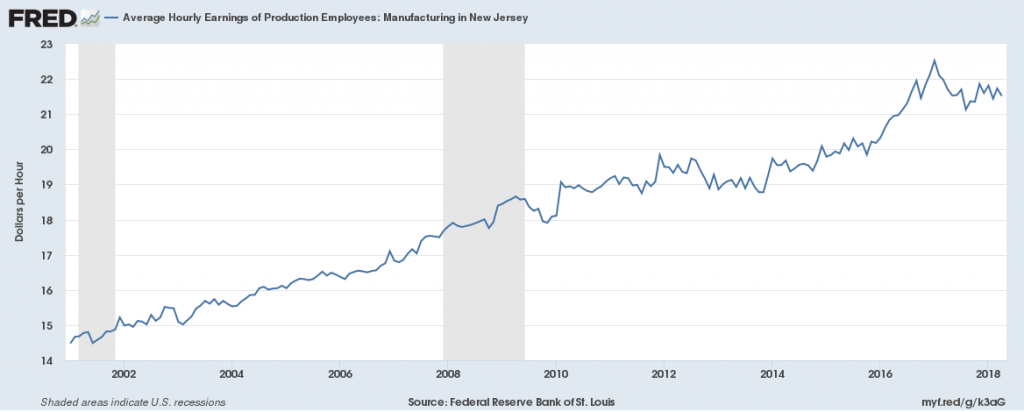
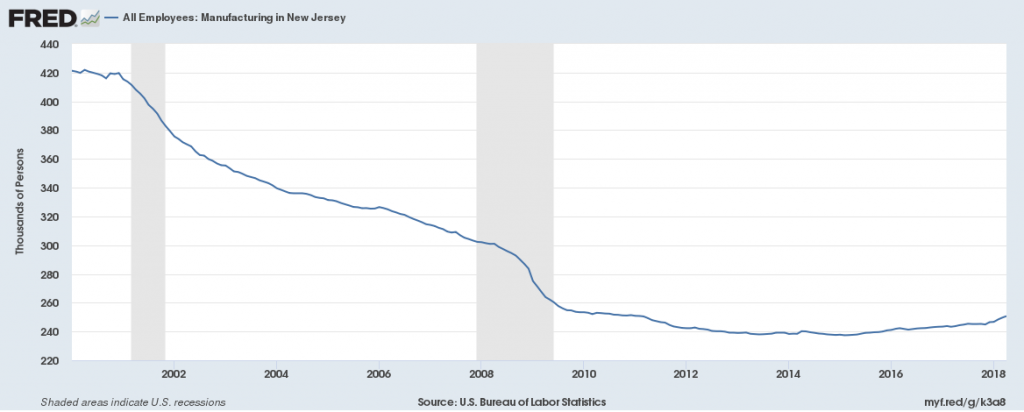
Manufacturing employment has been declining since 2000, especially during the 2008 recession, but steadied since then. There are currently 250,000 jobs in this sector in 2018, down from 420,000 in 2000. Average hourly wages of production employees has been rising steadily since 2000, growing from $18/hr in 2010 to $21.50 in 2018.
There were 200,000 jobs in the Transportation, Warehousing, and Utilities sector in 2018, exceeding the 2001 high of 180,000. The average wage in the Transportation, Trade and Utilities sector was $22.50/hr in 2010 and $26/hr in 2018.
![]()
![]()
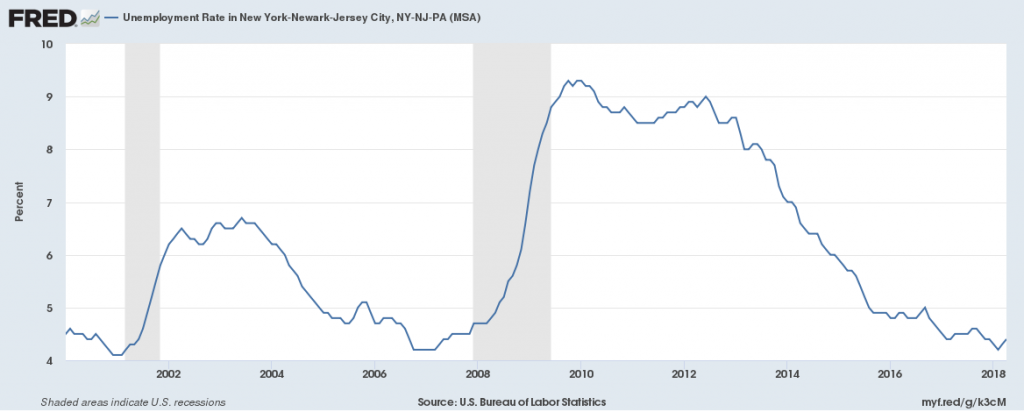
Unemployment
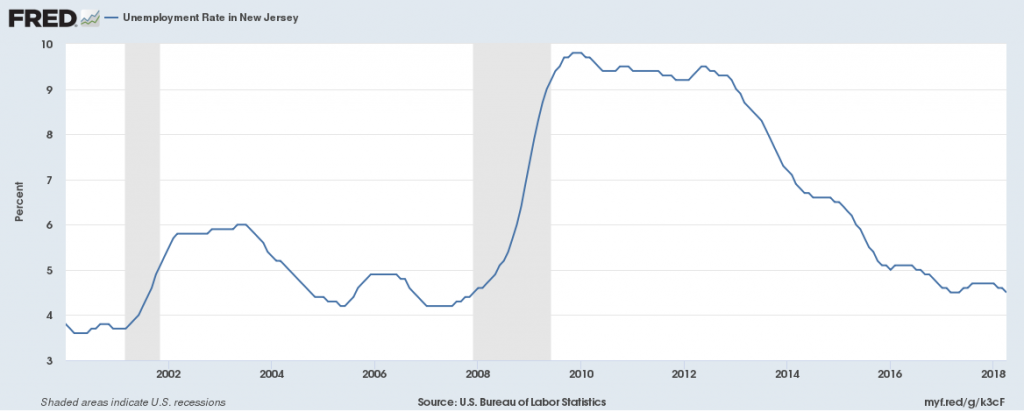
The unemployment rate in 2018 is 4.6%, the same as the year before. This is above the national average of 3.9% unemployment.
Housing
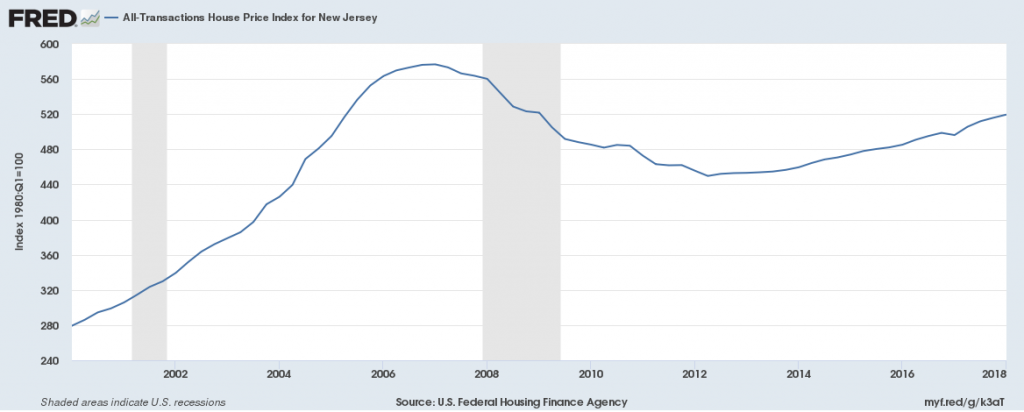
The House Price Index, a measure of the cost of housing, has declined since its 2007 high of 570. It has been increasing since 2012, hitting 520 in 2018, showing growing housing costs.
Newark, NJ-PA Metropolitan Division
Gross Domestic Product
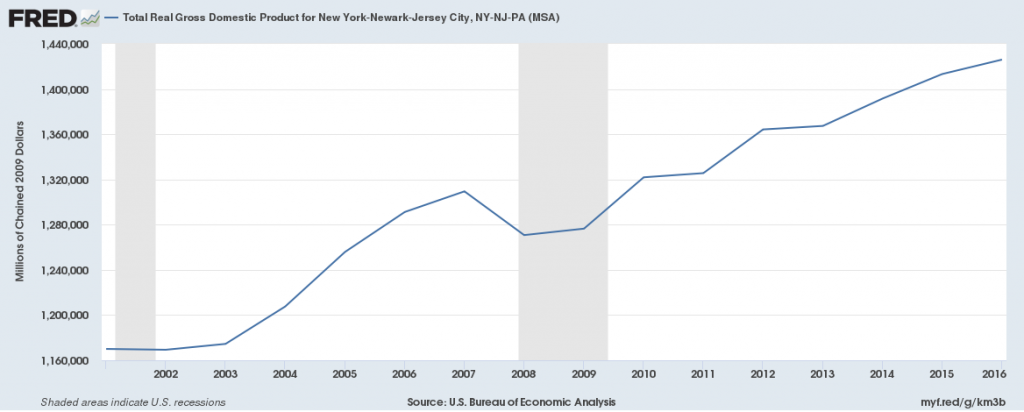
Real GDP (a measure of economic growth) has been steadily since 2009, hitting a peak of $1.426 trillion in 2016, exceeding the 2007 peak of $1.309 trillion.
Jobs
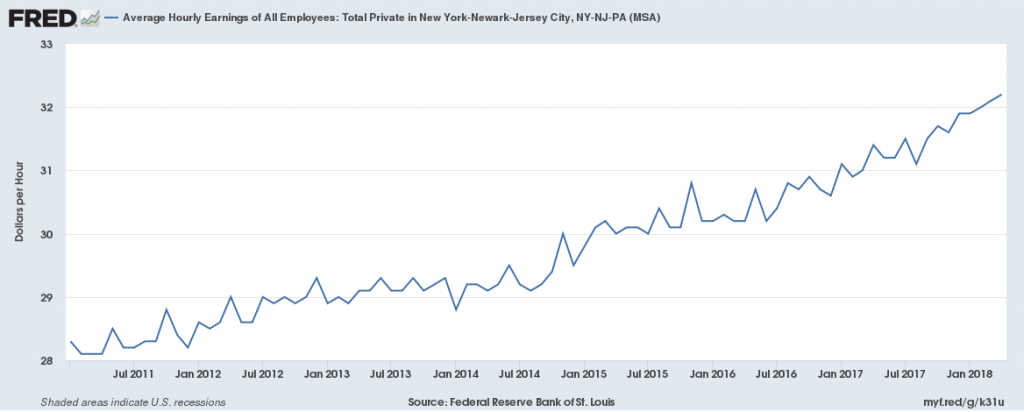
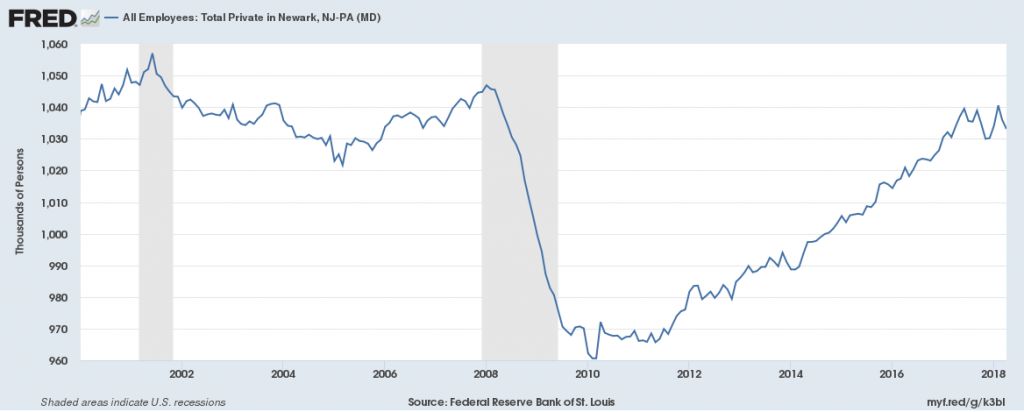
Private-sector employers have added 80,000 jobs since February 2010, showing an almost full recovery since the 2008 recession.
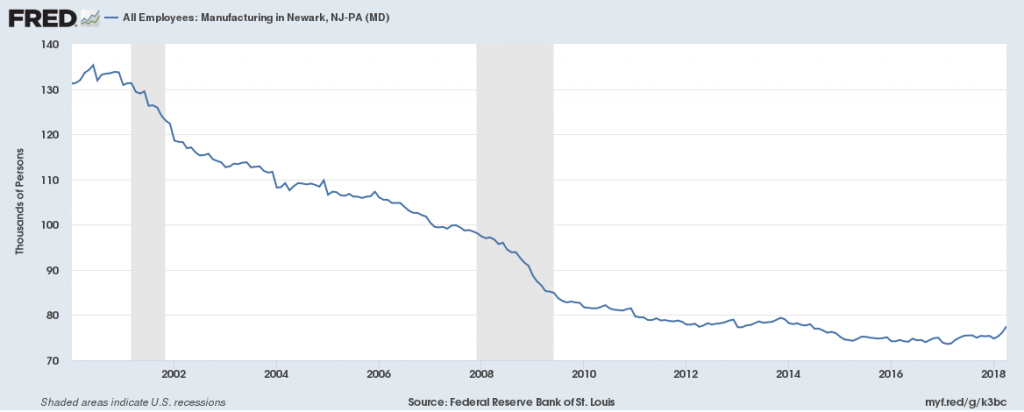
Manufacturing employment has been declining since 2000, especially during the 2008 recession. There are currently 78,000 jobs in this sector in 2018, down from 132,000 in 2000.
There were 65,000 jobs in the Transportation, Warehousing and Utilities sector in 2018, exceeding the 2001 high of 62,500.
![]()
Unemployment
The unemployment rate in the Newark, New York, Jersey City area was 4.3%, the same as the year before. This is above the national average of 3.9% unemployment.
Housing
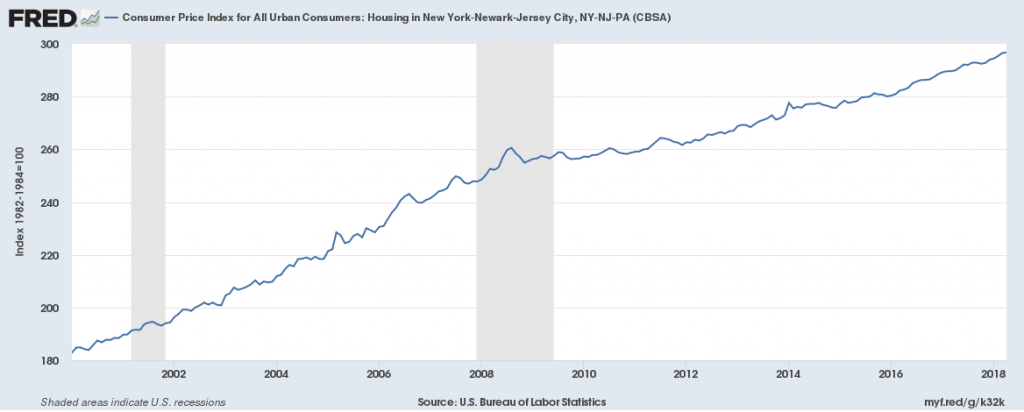
The Consumer Price Index for Housing (a measurement of housing costs) has increased steadily since 2000, going from 182 in 2000 to 295 in the New York-Newark-Jersey City Area. The Consumer Price Index for All Items (a measurement of cost of living) has increased similarly from 180 to 272 from 2000-2008.