Gross Domestic Product
Real GDP (a measure of economic growth) has been generally growing since 2000, hitting a peak of $1.28 trillion in 2017, exceeding the 2007 peak of $504 billion.
Jobs
Private-sector employers have added 1,200,000 jobs since February 2010, the national low point for private-sector employment and 1,000,000 more jobs than before the recession. From 2017 to 2018 the private sector has added approximately 100,000 net new jobs. Average hourly wages in the private sector have been increasing since 2009, going from $25.5/hr to $31/hr in 2018.
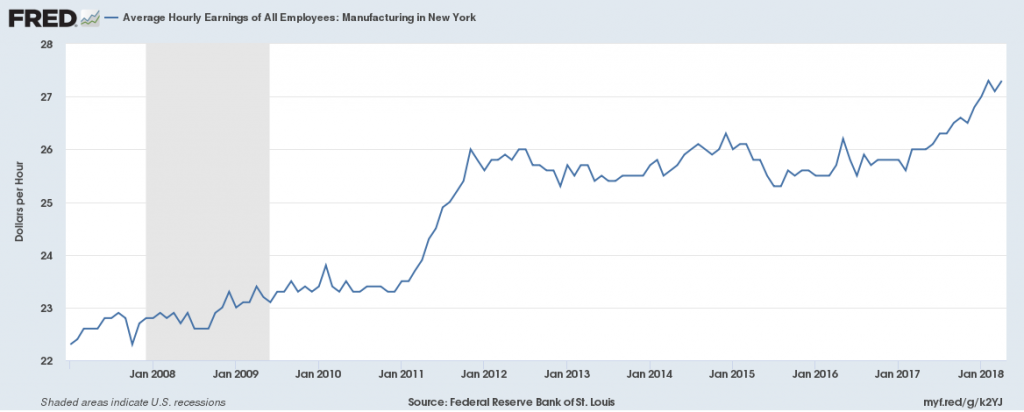
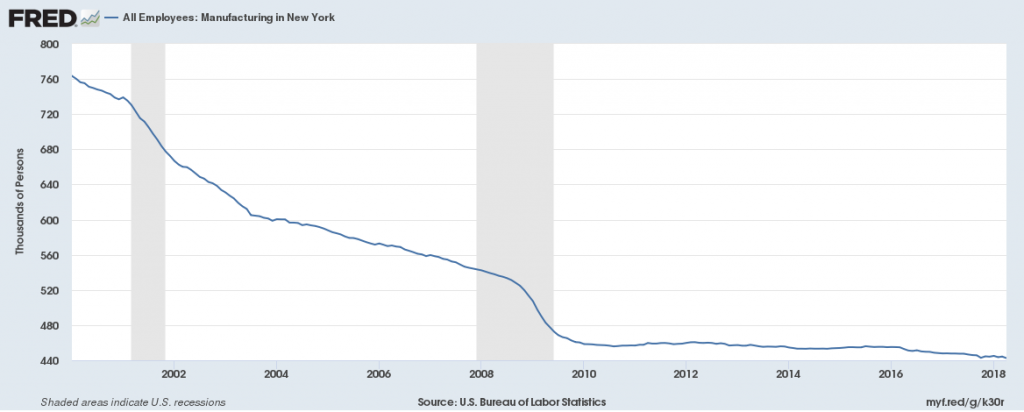
Manufacturing employment has been declining since 2000, especially during the 2008 recession, but steadied since then. There are currently 460,000 jobs in this sector in 2018, down from 760,000 in 2000. Average hourly wages of all employees in manufacturing rose significantly from 2011 to 2012, remained steady until 2017, and increased again. The average hourly wage in 2018 is $27.25/hr.
There were 200,000 jobs in the Transportation, Warehousing and Utilities sector in 2018, exceeding the 2001 high of 180,000. The average wage in the Transportation, Trade and Utilities sector was $21.50/hr in 2010 and $25.33/hr in 2018.
![]()
![]()
Unemployment
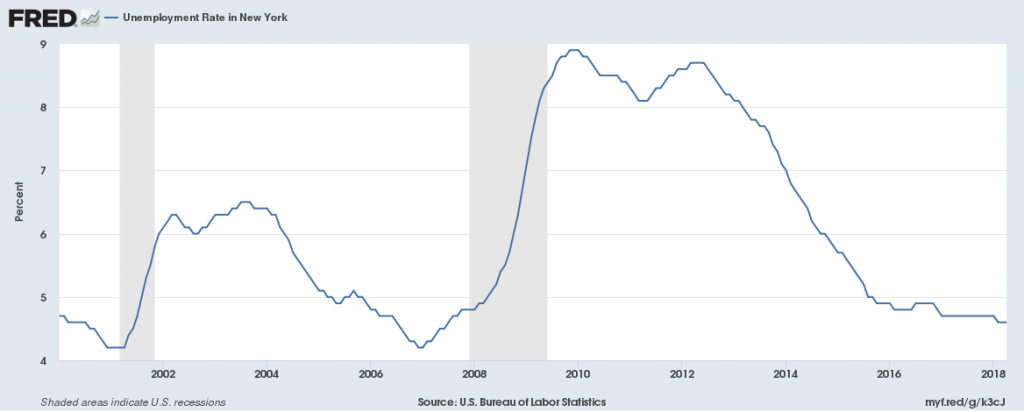
The unemployment rate in 2018 is 4.6%, slightly down from the year prior. This is above the national average of 3.9% unemployment.
Housing
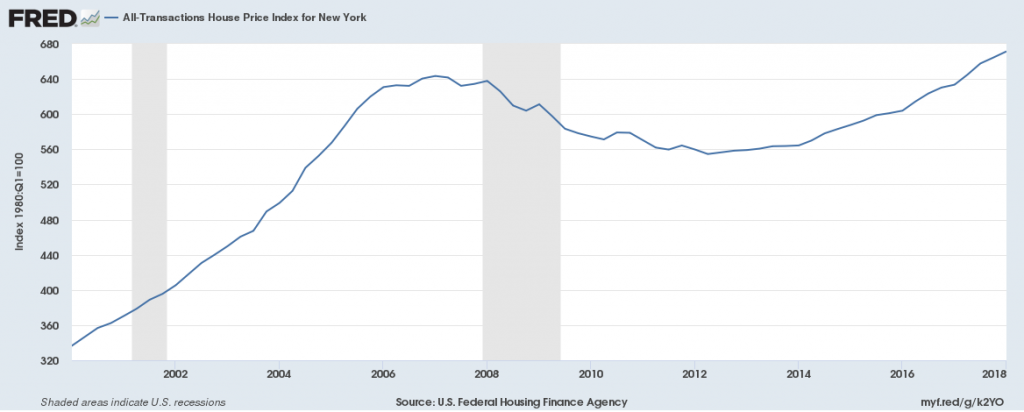
The House Price Index, a measure of the cost of housing, rose until 2006 to 640, declined until 2012 hitting 560, and rose to a high of 677 in 2018.
New York City
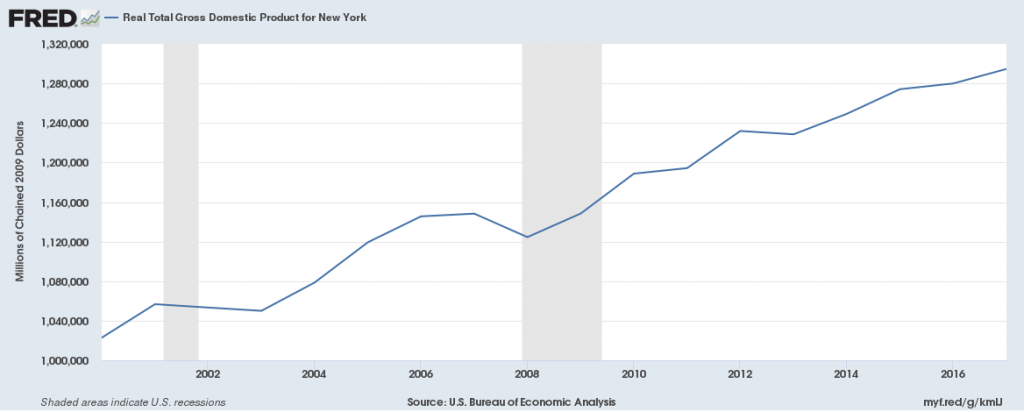
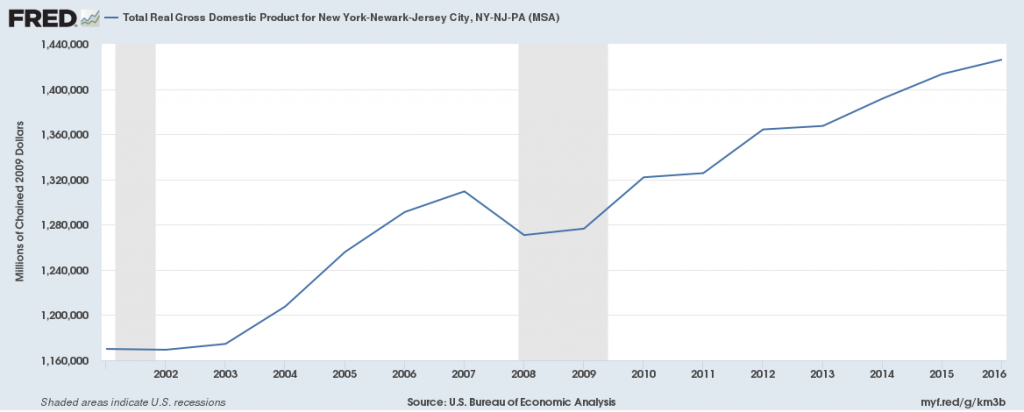
Gross Domestic Product
Real GDP (a measure of economic growth) has been steadily rising since 2011, hitting a peak of $510 billion in 2017, exceeding the 2007 peak of $504 billion.
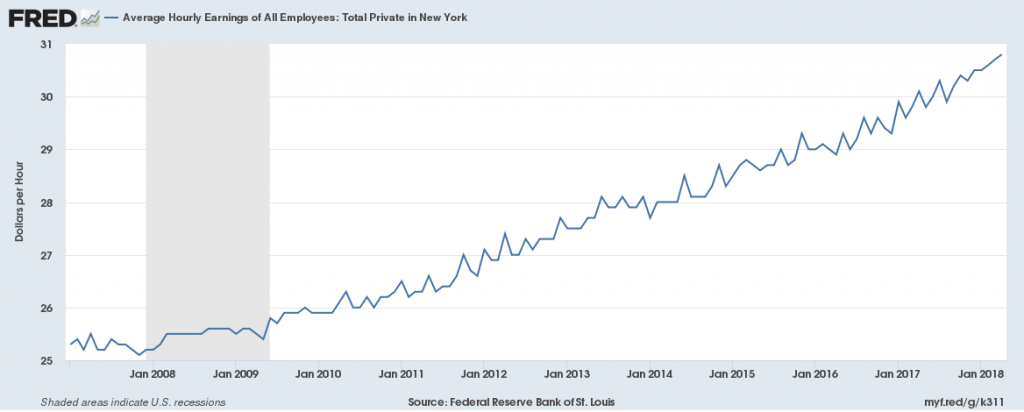
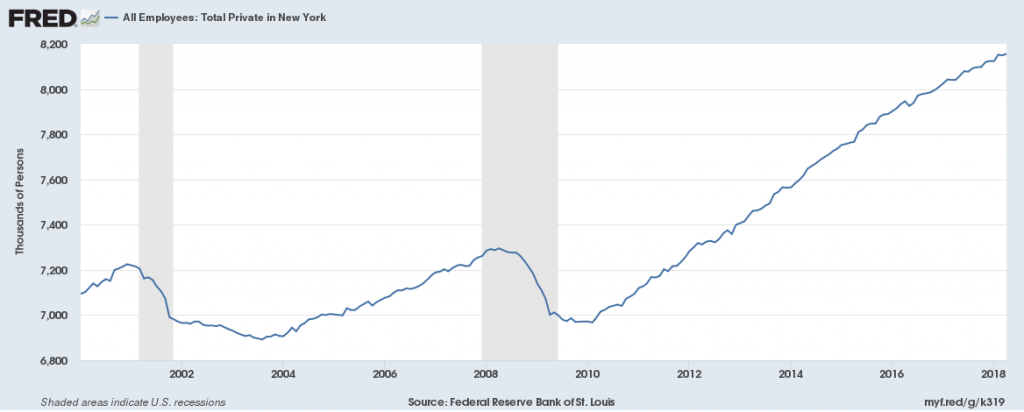
Jobs
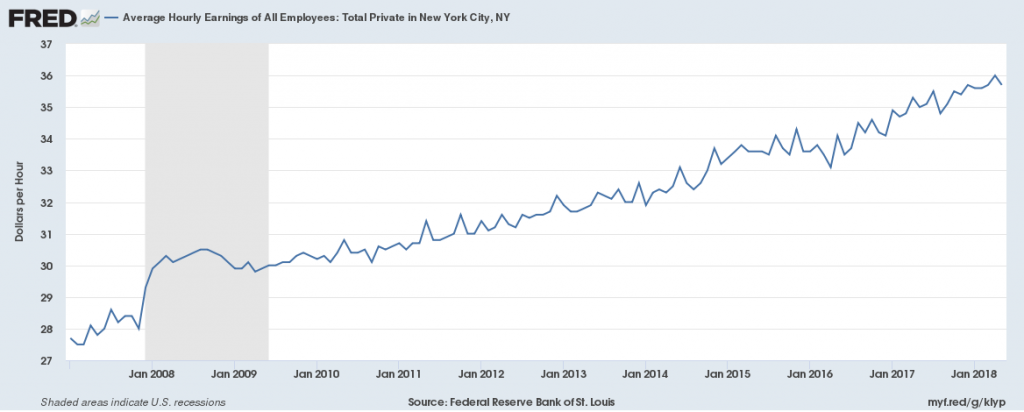
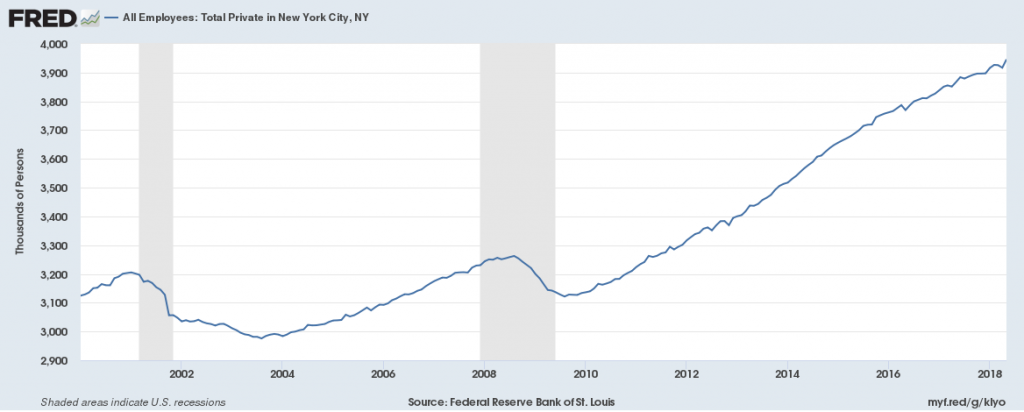
Private-sector employers have added 800,000 jobs since 2010, the national low point for private-sector employment, and 600,000 more jobs than before the recession. From 2017 to 2018 the private sector has added approximately 100,000 net new jobs. Average hourly wages in the private sector have been increasing since 2011, going from $30/hr to $36/hr in 2018.
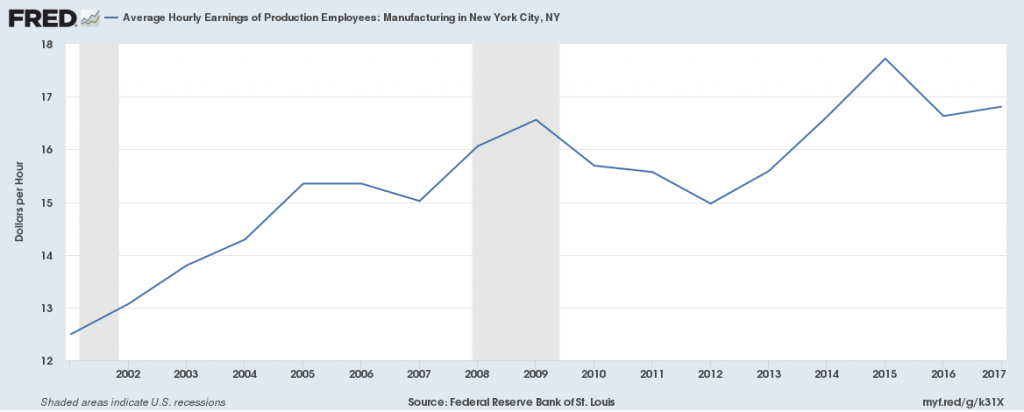
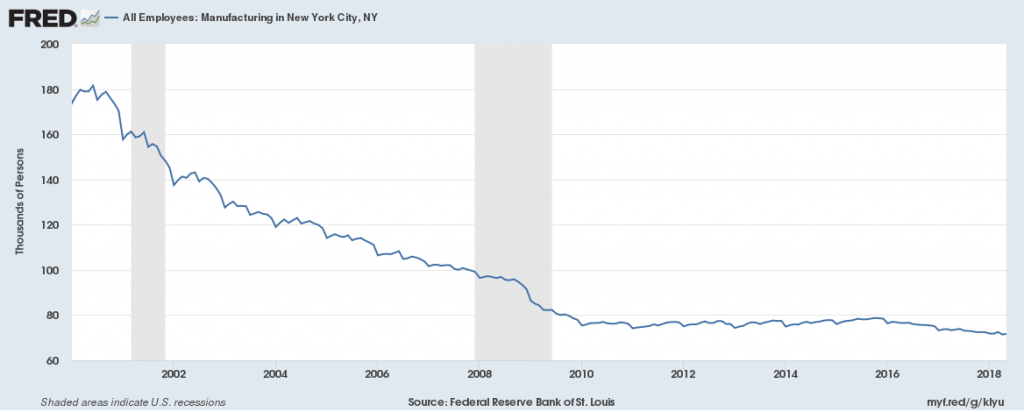
Manufacturing employment has been declining since 2000, especially during the 2008 recession, but steadied since then. There are currently 71,000 jobs in this sector in 2018, down from 180,000 in 2000. Average hourly wages of all employees in manufacturing fell after 2009 but began to rise in 2012, going from $15/hr to $17/hr in 2017.
There were 120,000 jobs in the Transportation and Warehousing sector in 2018, the same as the 2001 high. The average wage in the Transportation, Trade and Utilities sector was $19.70 in 2018.
![]()
![]()
Unemployment
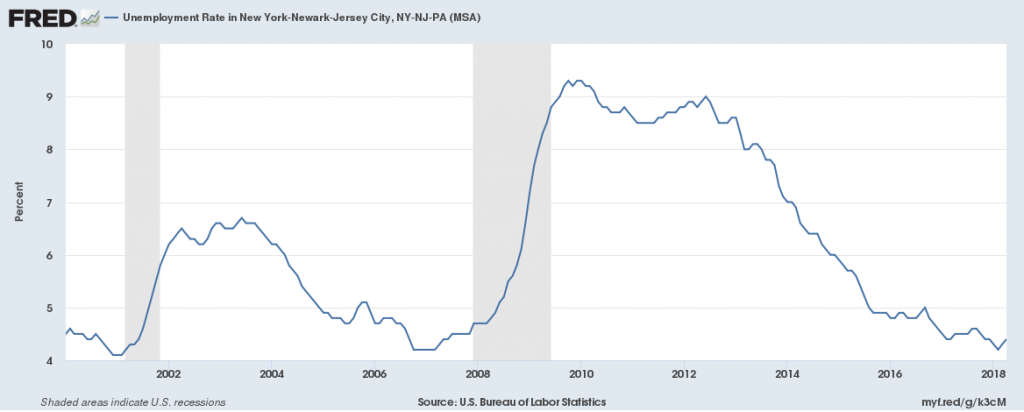
The unemployment rate in 2018 is 4.2%, slightly above the national average of 3.9% unemployment.
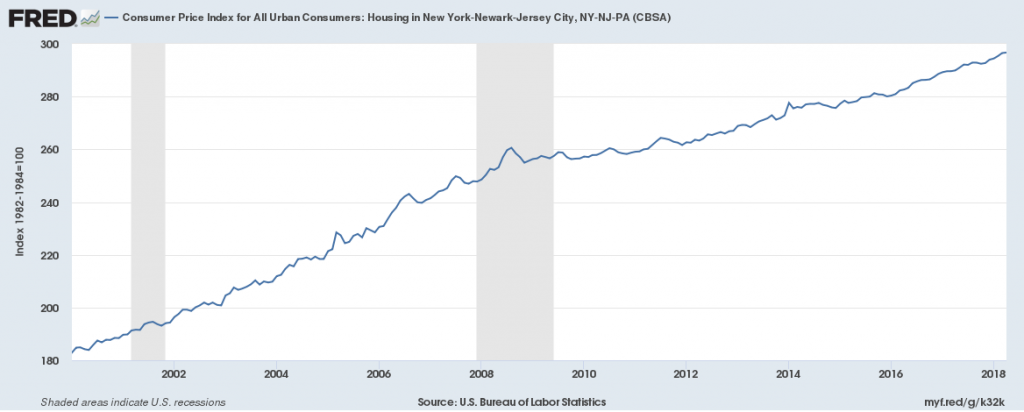
Housing
The Consumer Price Index for Housing has been rising since 2000, growing more than 50%, showing a large increase in housing costs in the area.