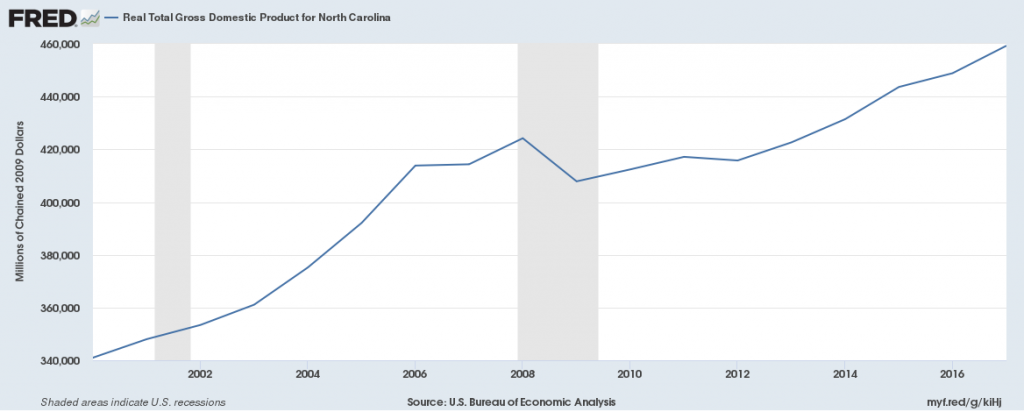
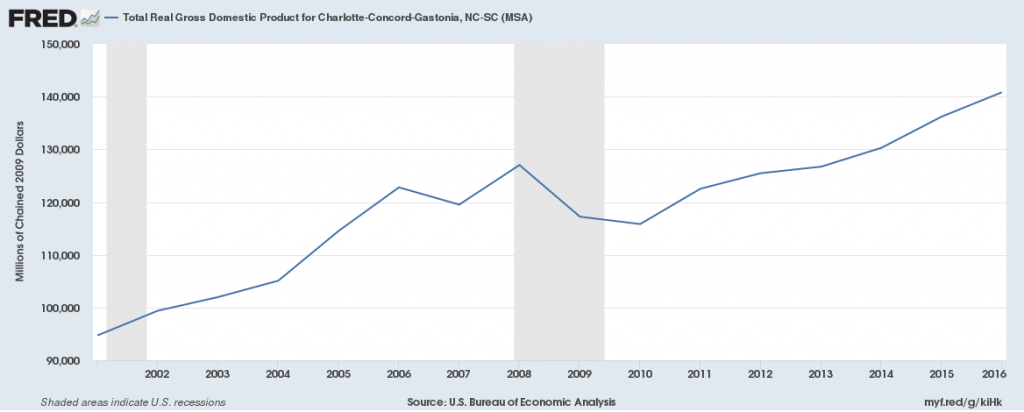
Gross Domestic Product
Real GDP (a measure of economic growth) has been increasing since 2009 from the most recent low of $409 billion. It has grown to $460 billion by 2017, higher than pre-recession levels of $425 billion in 2008.
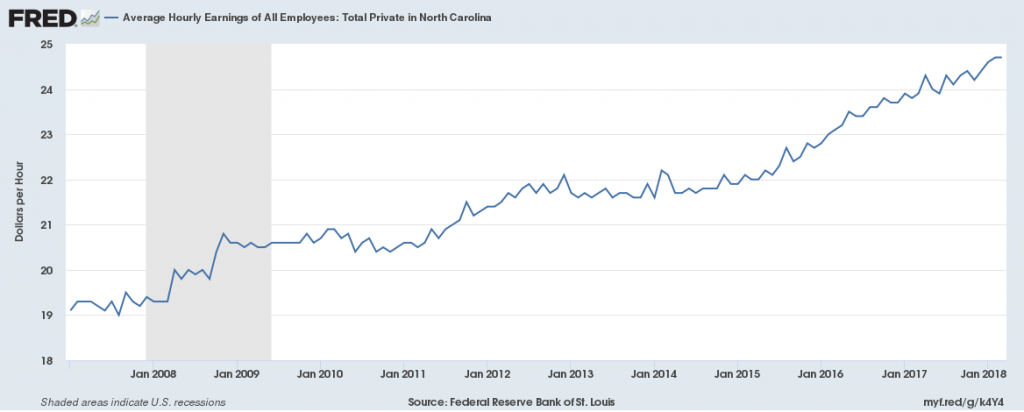
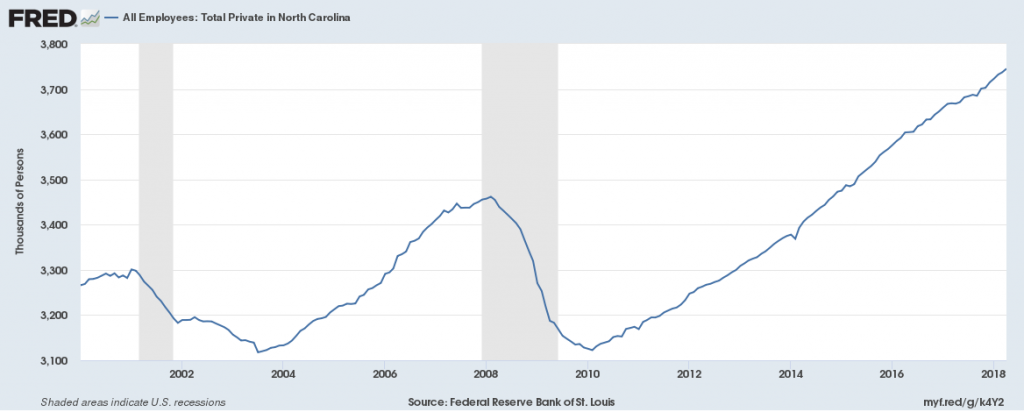
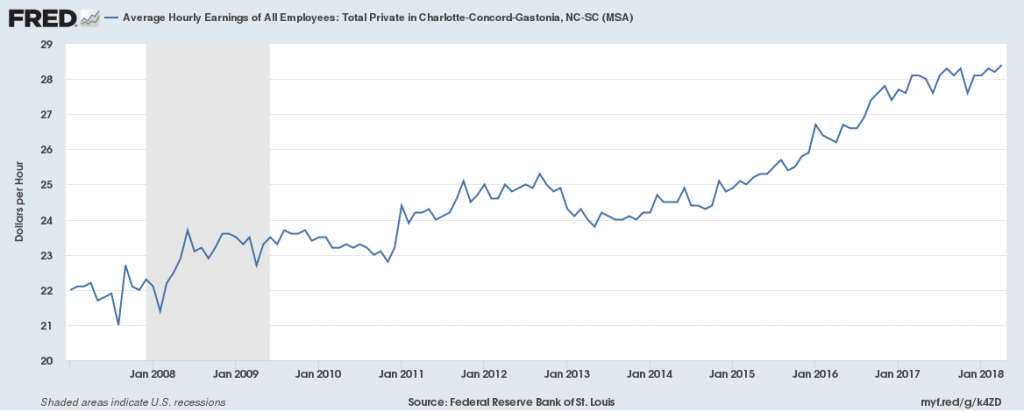
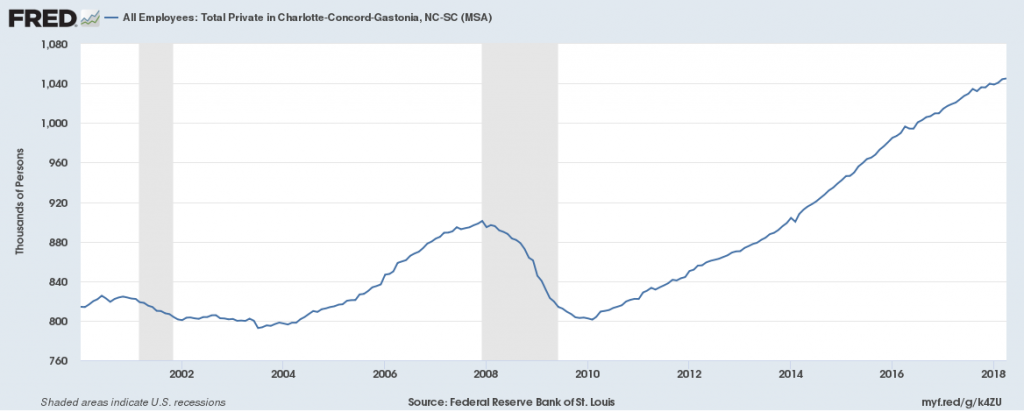
Jobs
Private-sector employers have added 600,000 jobs since 2010, the national low point for private-sector employment. From 2017 to 2018 the private sector has added approximately 50,000 net new jobs for a total of 3,740,000, putting it above the pre-recession high of 3,450,000 total jobs in the state’s private sector in 2008. Average hourly wages in the private sector have grown since 2008, going from $20/hr to $24.75/hr in 2018.
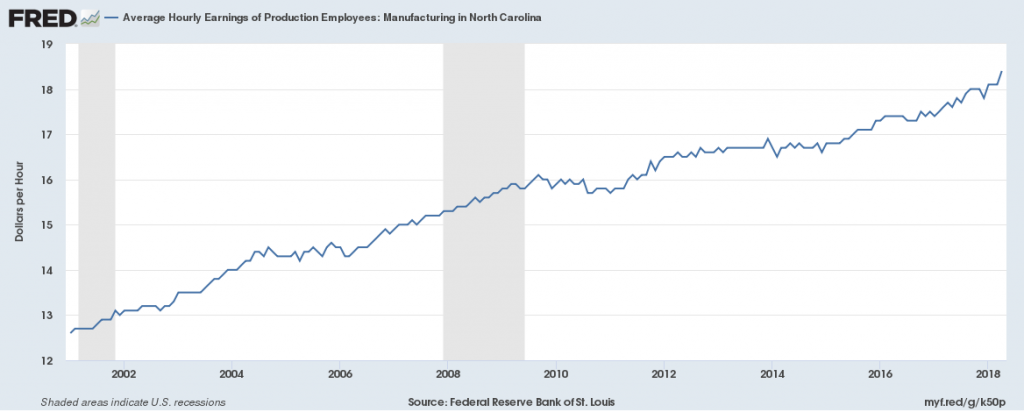
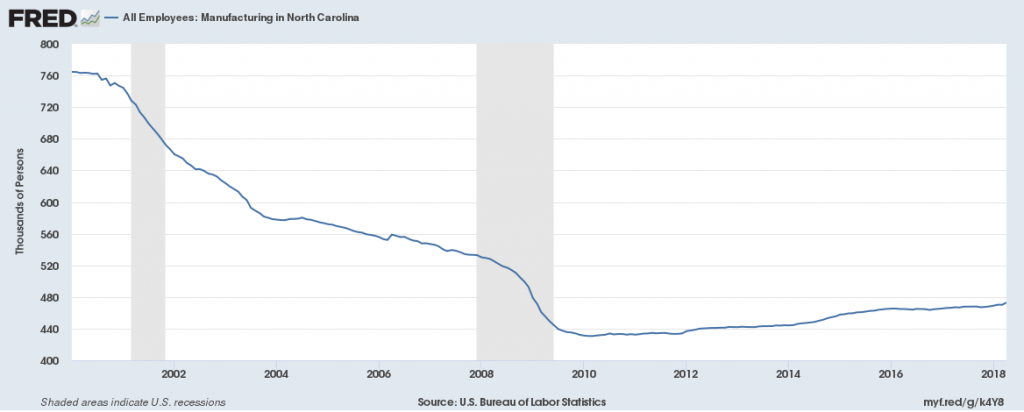
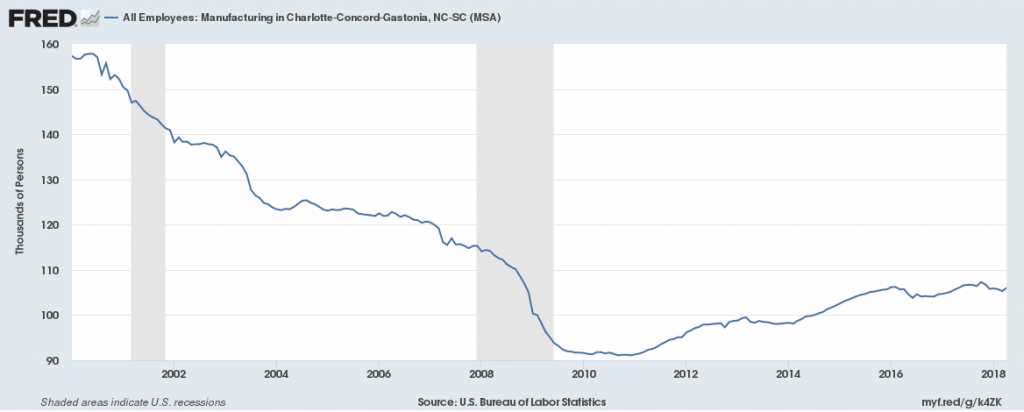
Manufacturing employment has been declining since 2000, especially during the 2008 recession, but has grown slightly since then. There are 478,000 jobs in this sector in 2018, 50,000 less than pre-recession levels. Average hourly wages of production employees have been increasing steadily since 2002, stagnating during 2010-2012, but growing since then going from $16/hr in 2012 to approximately $18.50/hr in 2018.
There were 133,000 jobs in the Transportation and Warehousing sector in 2018, 30,000 jobs above its 2010 low and 13,000 above pre-recession levels, showing growth in this sector. The average wage in Trade, Transportation and Utilities occupations has grown from $18/hr in 2008 to $23/hr 2018.
![]()
![]()
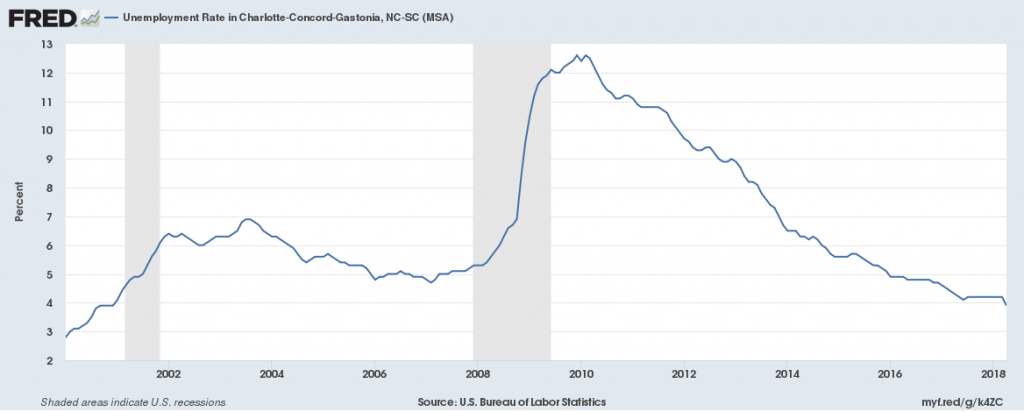
Unemployment
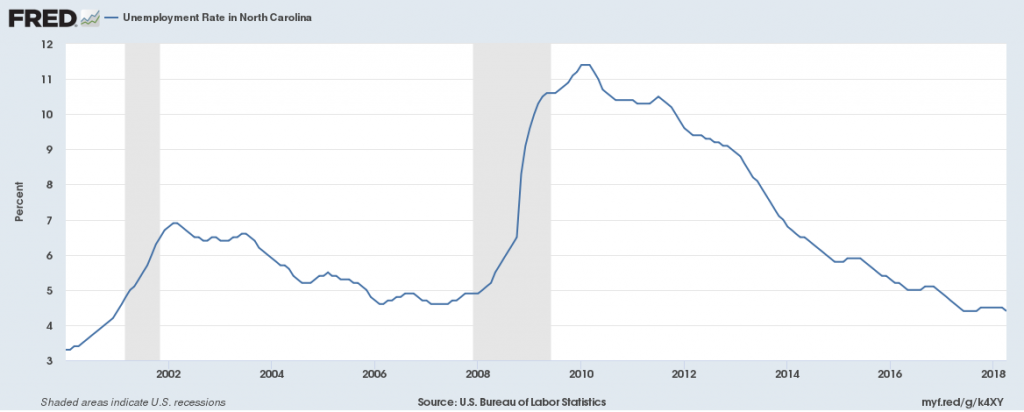
The unemployment rate in 2018 is 4.4%, down from the prior year’s 5% rate. This is above the national average of 3.9% unemployment.
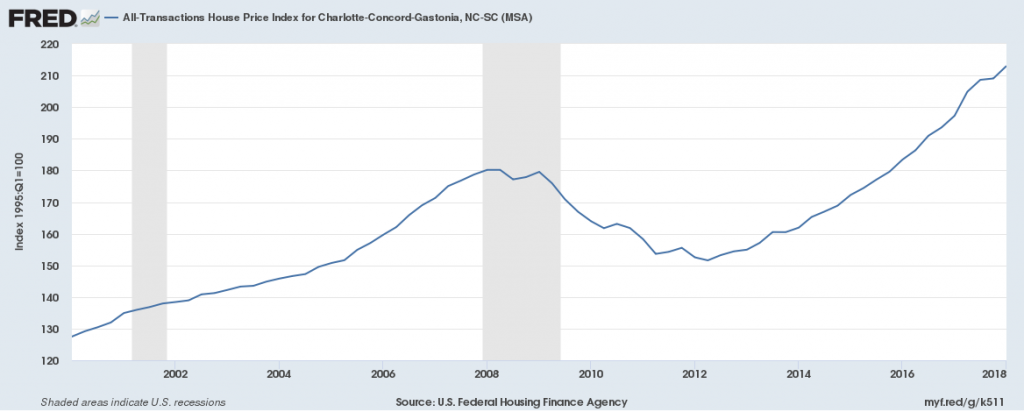
Housing
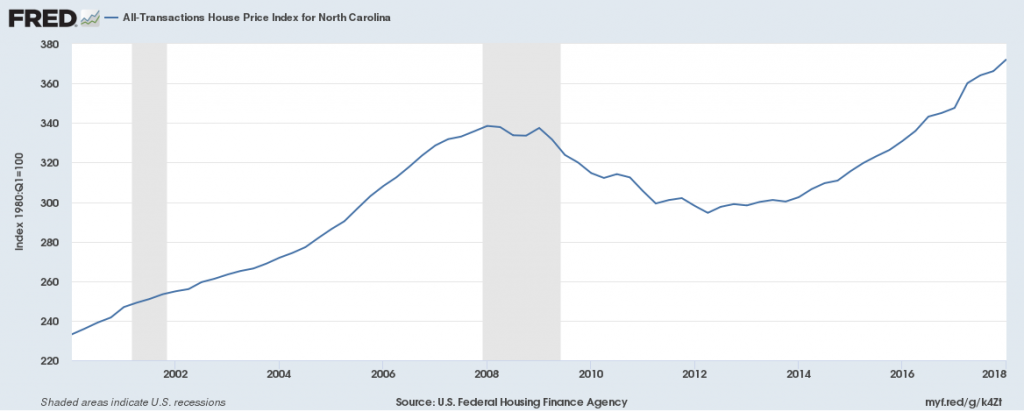
The House Price Index, a measure of the cost of housing, declined after 2008 until 2013 when it grew from 300 in 2013 to 370 in 2018, showing increased housing costs.
Charlotte – Concord
Gross Domestic Product
Jobs
Private-sector
Manufacturing
Transportation, Warehousing and Utilities
![]()
Unemployment
Housing