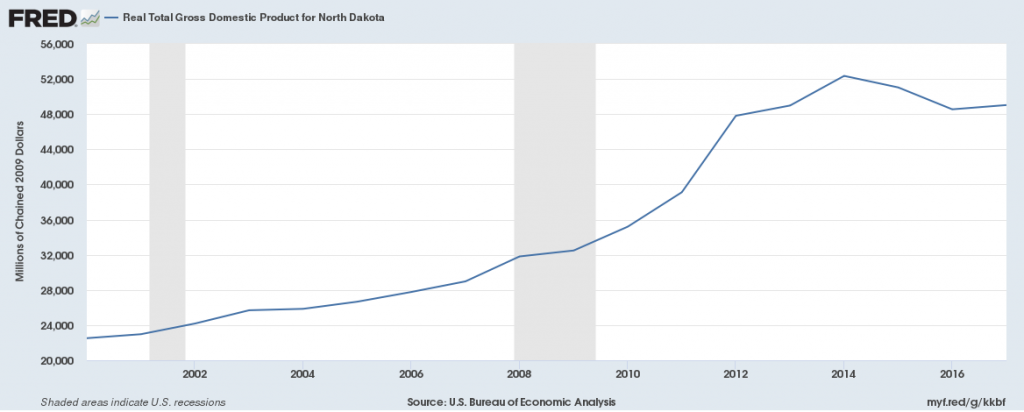
Gross Domestic Product
Real GDP (a measure of economic growth) increased from 2000-2014, going from $22.5 billion to $52 billion, but has declined since 2014 to $48.5 billion by 2016.
Jobs
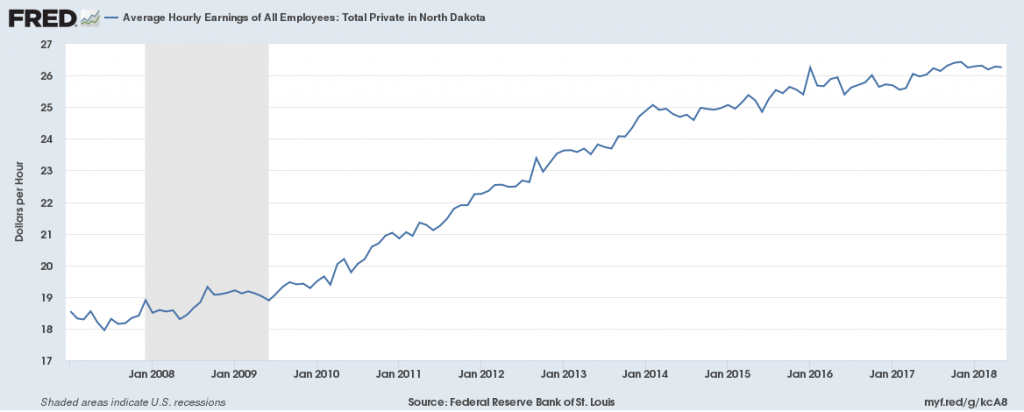
Private-sector employers have added 60,000 jobs since 2010, the national low point for private-sector employment. From 2017 to 2018 the private sector did not add any new jobs. There were 350,000 total jobs in the private sector in 2018, above pre-recession levels but below the 2015 peak of 380,000. Average hourly wages in the private sector have grown since 2007, going from $18.50/hr to $26.20/hr in 2018.
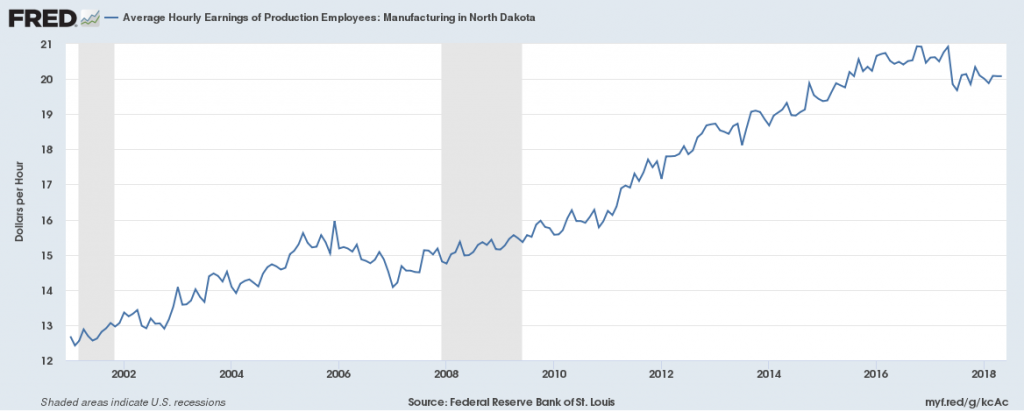
Manufacturing employment decreased during the recession but has almost recovered since then. There were 25,250 jobs in this sector in 2018, down from 26,500 in 2008. Average hourly wages of manufacturing employees have grown since 2001, going from $12/hr to $20/hr by 2018.
There were 23,000 jobs in the Trade, Transportation and Utilities sector in 2018, below pre-recession levels by 5,000 jobs, showing a decline in this sector. The average wage in the Trade, Transportation and Utilities sector was $18/hr in 2008 and $26.50/hr in 2018.
![]()
![]()
Unemployment
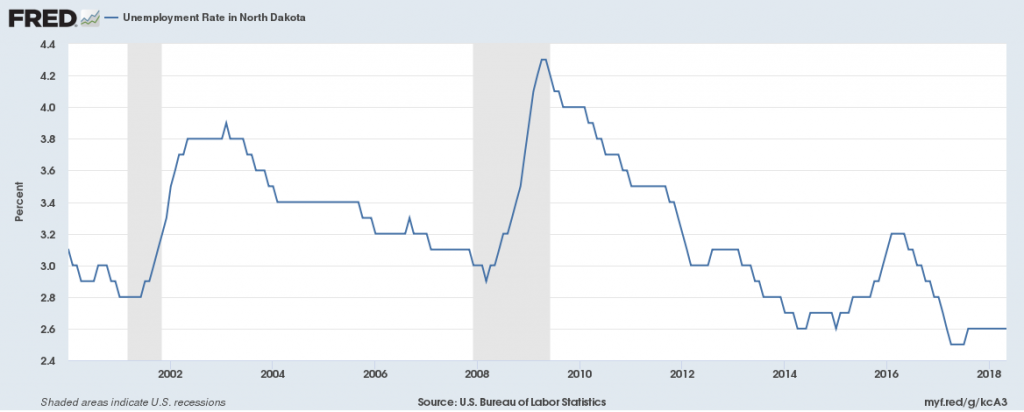
The unemployment rate in 2018 is 2.6%, down from the prior year’s 2.8% rate. This is below the national average of 3.9% unemployment.
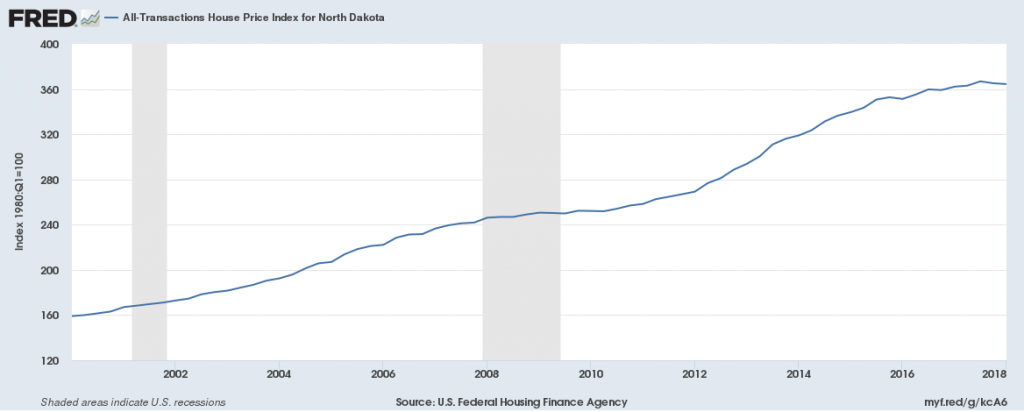
Housing
The House Price Index, a measure of the cost of housing, has been increasing since 2000, going from 160 to 360, showing an increase in housing costs.