Gross Domestic Product
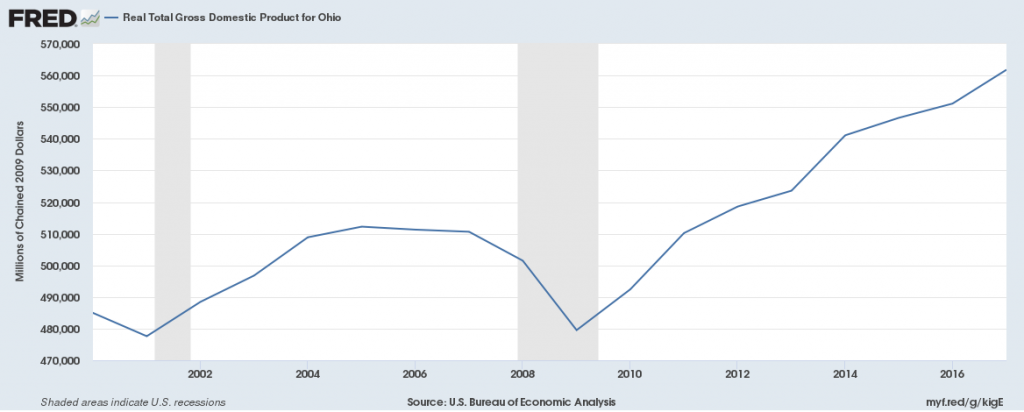
Real GDP (a measure of economic growth) has been increasing since 2009 from the most recent low of $480 billion. It has been growing since then and is at a high of $560 billion in 2018.
Jobs
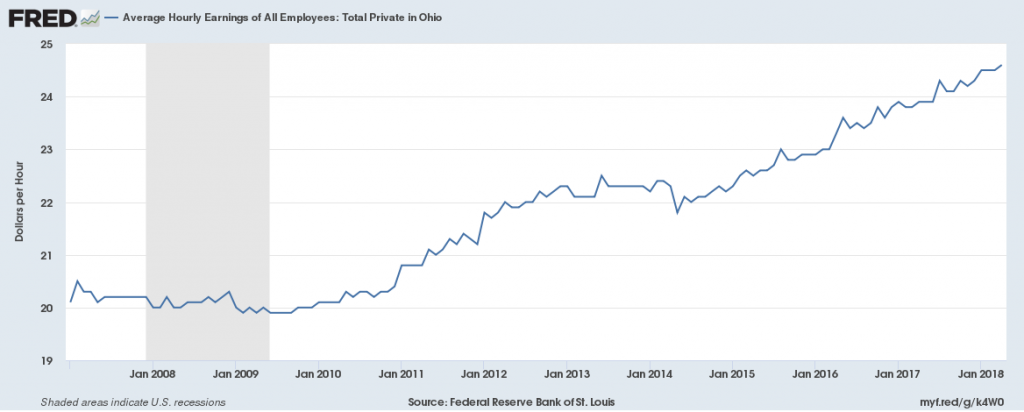
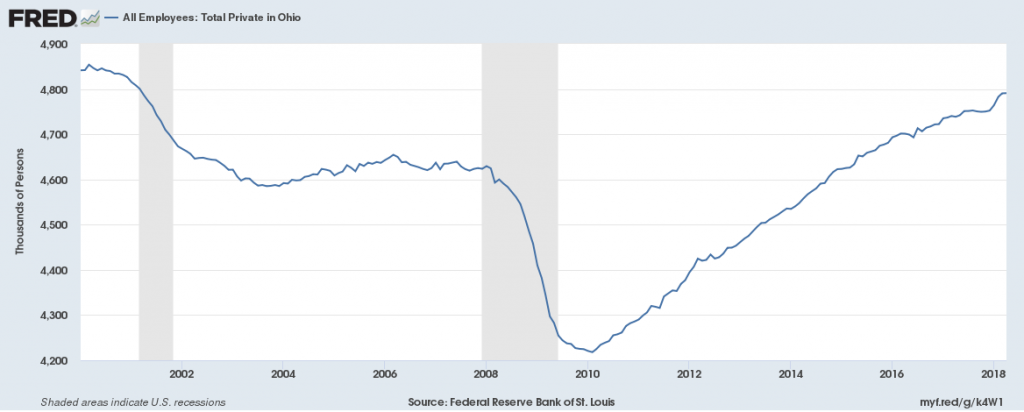
Private-sector employers have added 580,000 jobs since 2010, the national low point for private-sector employment. From 2017 to 2018 the private sector has added approximately 50,000 net new jobs, putting it above the pre-recession high of 4,600,000 total jobs but below the 2000 high of 4,900,000 jobs. Average hourly wages in the private sector have been slowly increasing since 2009, going from $20/hr to $24.50/hr in 2018.
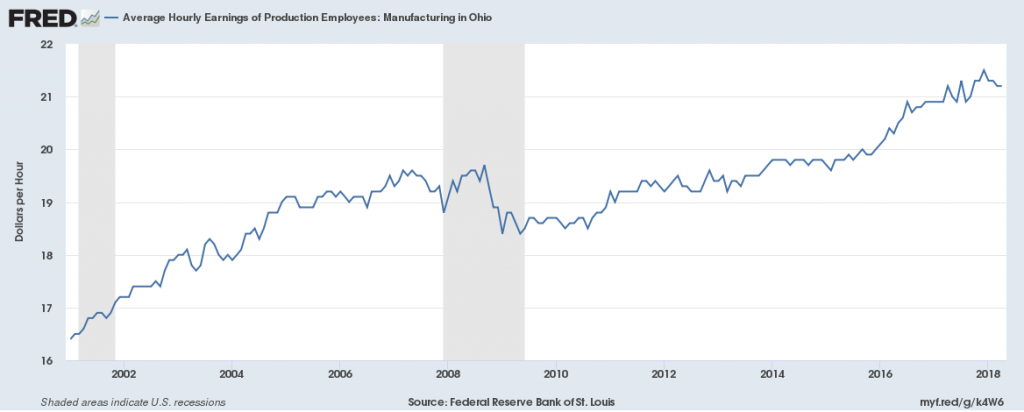
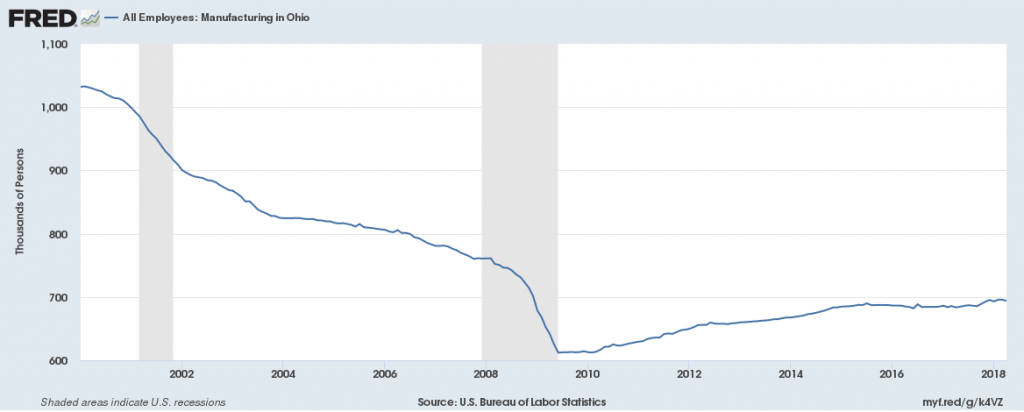
Manufacturing employment has been declining since 2000, especially during the 2008 recession, but has been growing since then. There are currently 700,000 jobs in this sector in 2018, down from 1,350,000 in 2000. Average hourly wages of production employees declined during the recession, but have been rising since 2010, growing from $18.50/hr in 2010 to $21.50/hr in 2018.
There were 200,000 jobs in the Transportation and Warehousing sector in 2018, slightly above its 2008 low, showing a recovery in employment in this sector. The average wage in the Transportation, Trade and Utilities sector was $18.50/hr in 2010 and $22.50/hr in 2018.
![]()
![]()
Unemployment
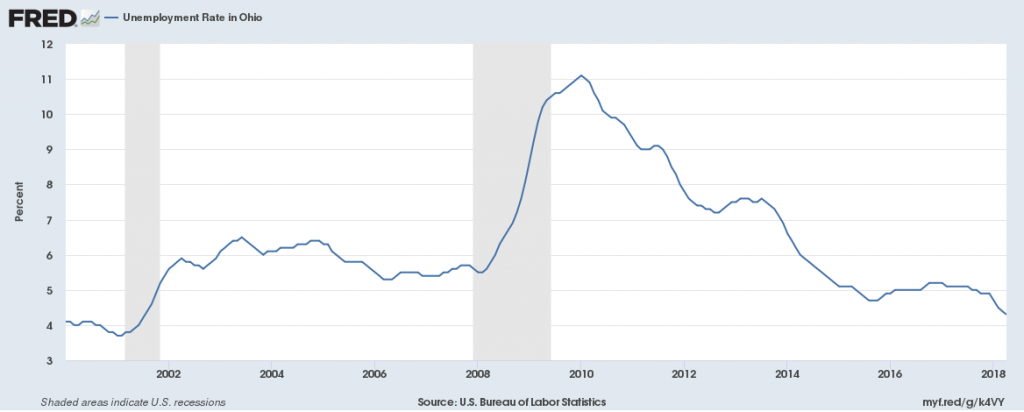
The unemployment rate in 2018 is 4.3% slightly down from the year before. This is above the national average of 3.9% unemployment.
Housing
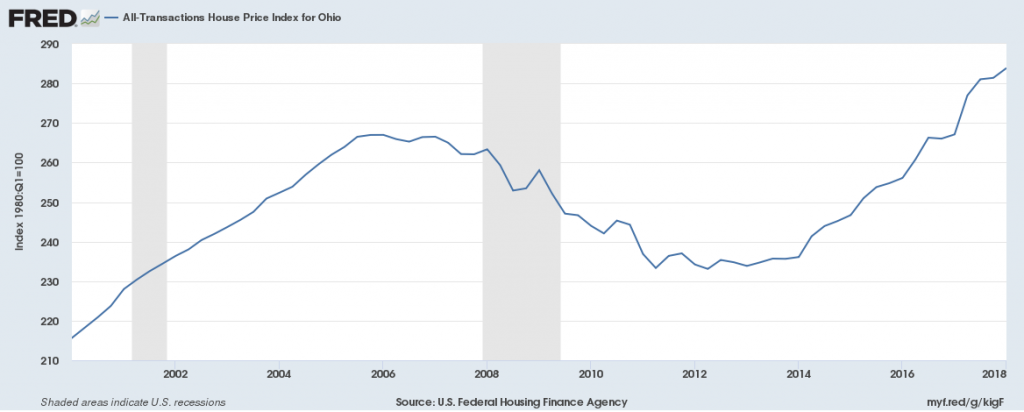
The House Price Index, a measure of the cost of housing, declined since its 2007 high of 267. It has been increasing since 2012, hitting 284 in 2018, showing growing housing costs, though the cost of housing is still below the national average of 414.
Columbus
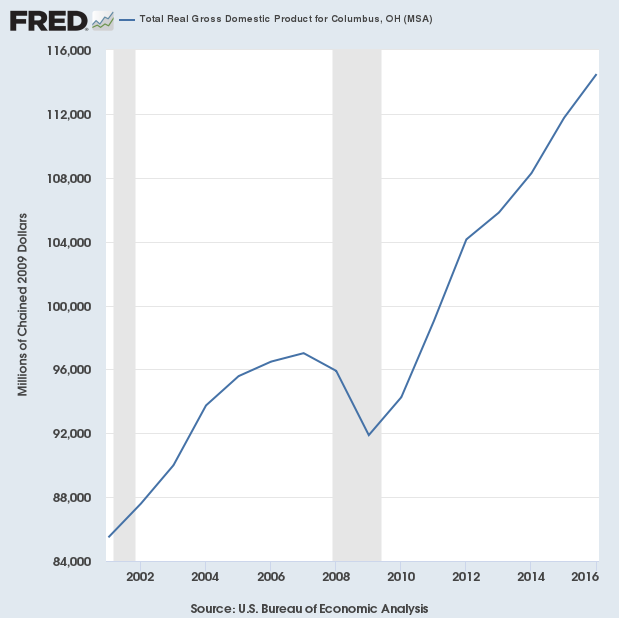
Gross Domestic Product
Real GDP (a measure of economic growth) has been increasing since 2009 from the most recent low of $92 billion. It has been growing since then and is at a high of $114 billion in 2018.
Jobs
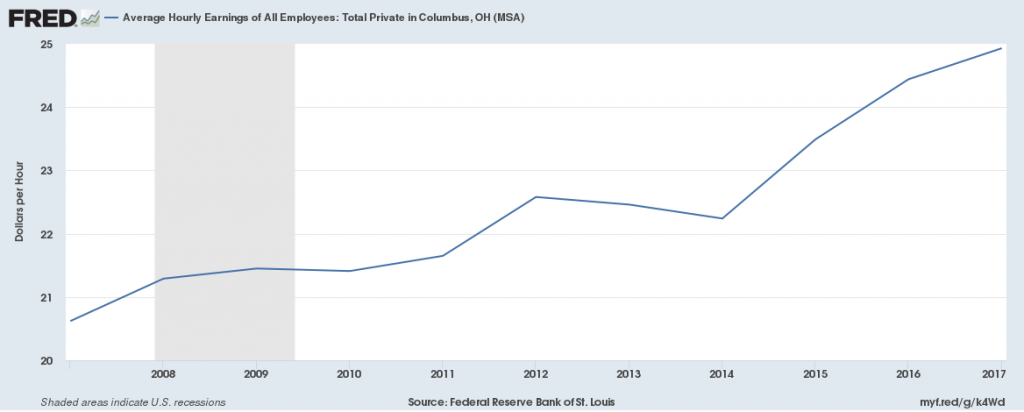
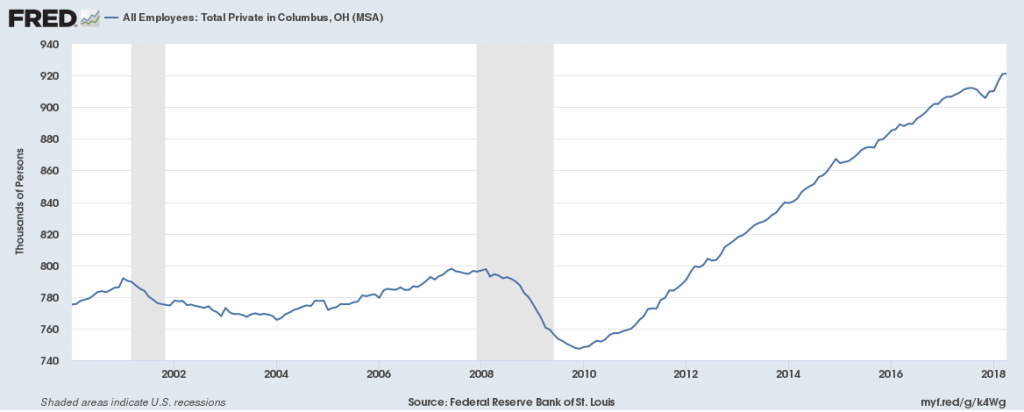
Private-sector employers have added 270,000 jobs since 2010, the national low point for private-sector employment. From 2017 to 2018 the private sector has added approximately 11,000 net new jobs, putting it above the pre-recession high of 800,000 total jobs. Average hourly wages in the private sector have been slowly increasing since 2007, going from $20.75/hr to $25/hr in 2018.
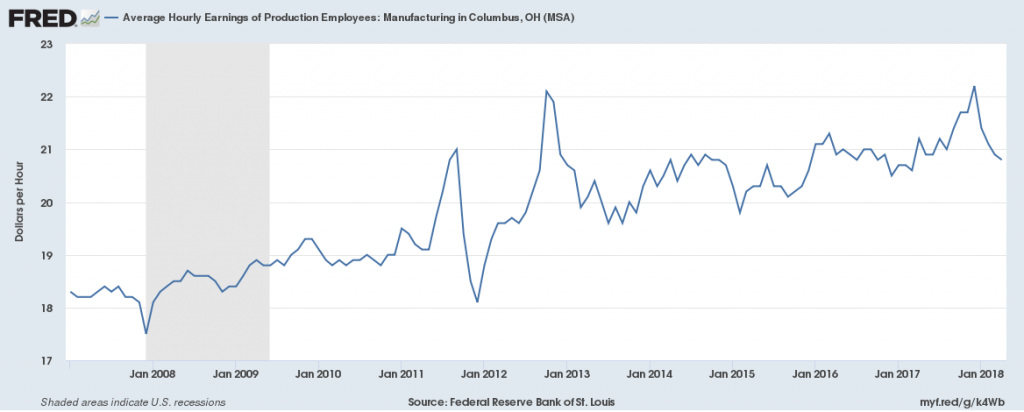
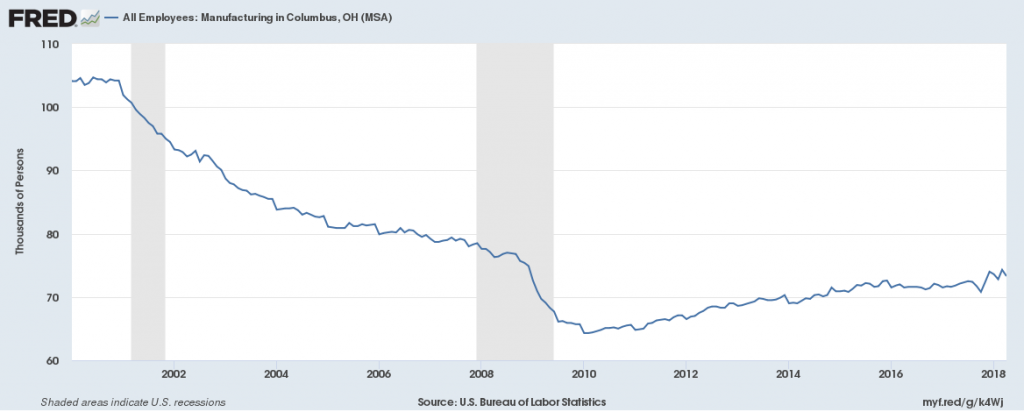
Manufacturing employment has been declining since 2001, especially during the 2008 recession, but has been growing slightly since then. There are currently 74,000 jobs in this sector in 2018, down from 105,000 in 2001. Average hourly wages of production employees have been unsteadily increasing since 2008, growing from approximately $18.50/hr in 2010 to $21.50/hr in 2018.
There were 52,000 jobs in the Transportation and Warehousing sector in 2018, 5000 jobs above its 2008 low, showing a recovery in this sector. The average wage in the Transportation and Material Moving occupations was $16.13/hr in 2018.
![]()
Unemployment
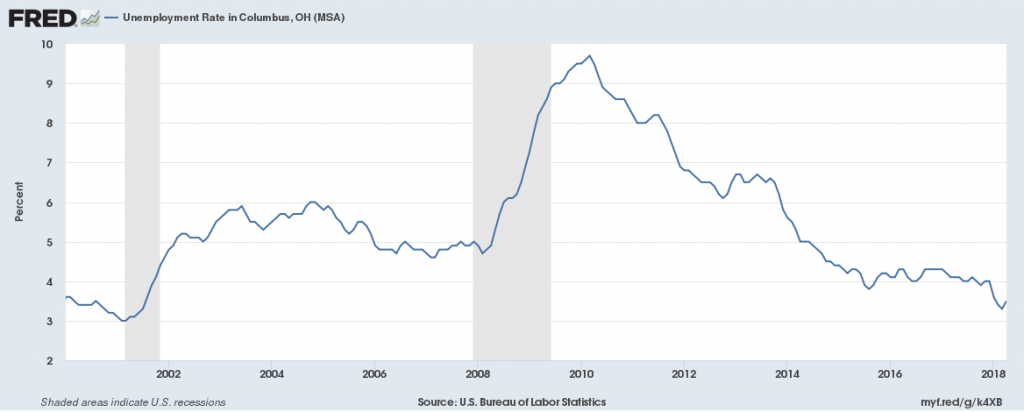
The unemployment rate in 2018 is 3.5% slightly down from the year before. This is above the national average of 3.9% unemployment.
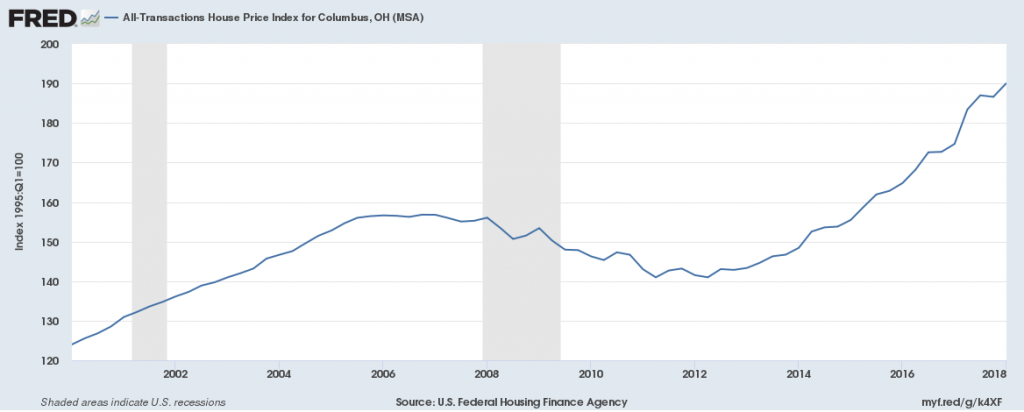
Housing
The House Price Index, a measure of the cost of housing, declined since its 2007 high of 267. It has been increasing since 2012, hitting 190 in 2018, showing growing housing costs, though the cost of housing is still below the national average of 414.