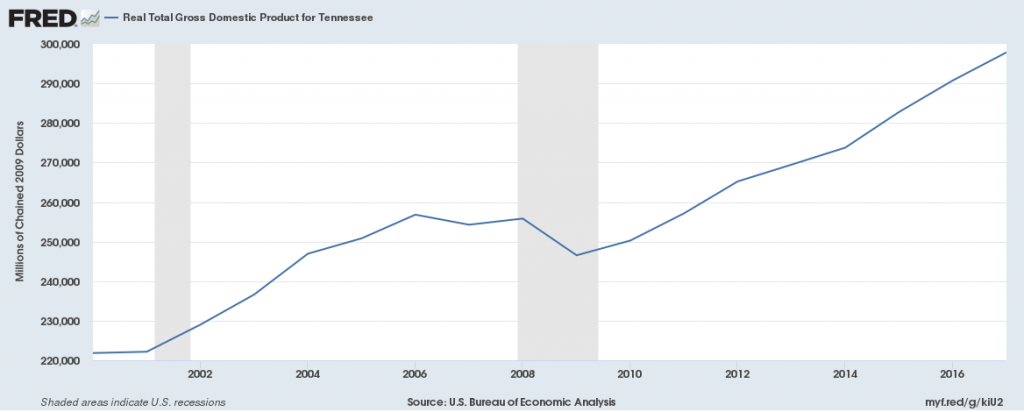
Gross Domestic Product
Real GDP (a measure of economic growth) increased from 2009-2017 from the 2009 low of $247 billion to $300 billion in 2016.
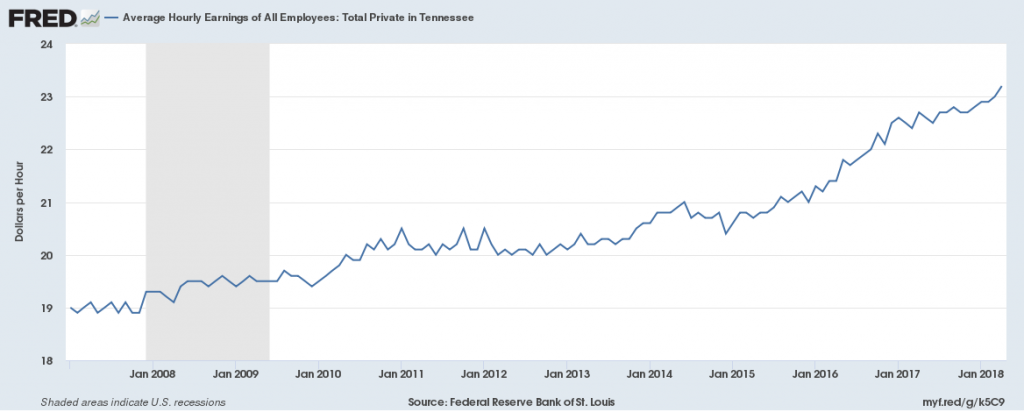
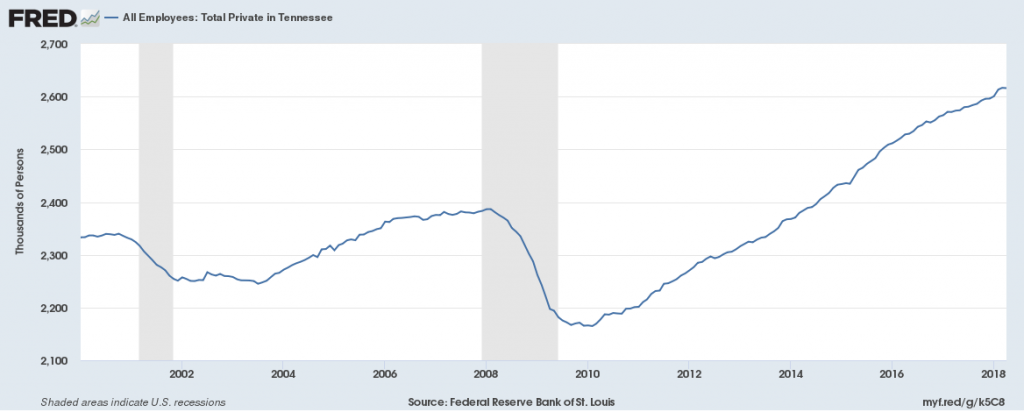
Jobs
Private-sector employers have added 400,000 jobs since 2010, the national low point for private-sector employment. From 2017 to 2018 the private sector has added approximately 60,000 net new jobs for a total of 2,600,000 putting it above the 2008 pre-recession high of 2,390,000 total jobs. Average hourly wages in the private sector have grown since 2008, going from $19/hr to $23/hr in 2018.
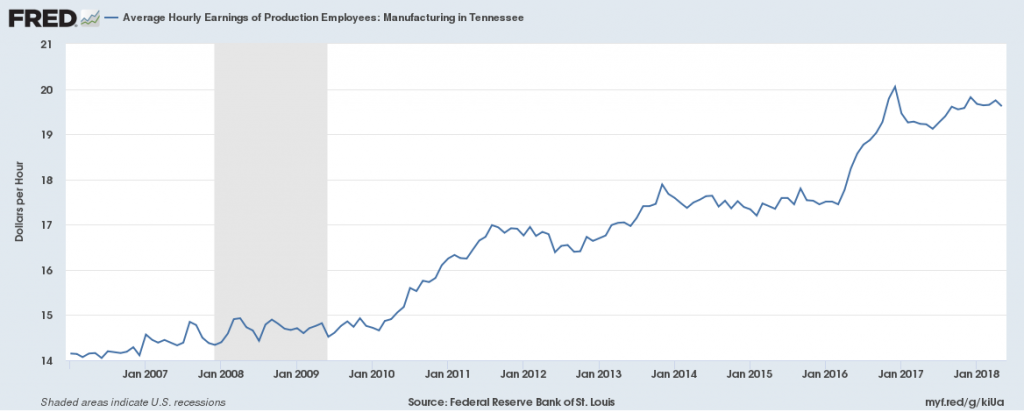
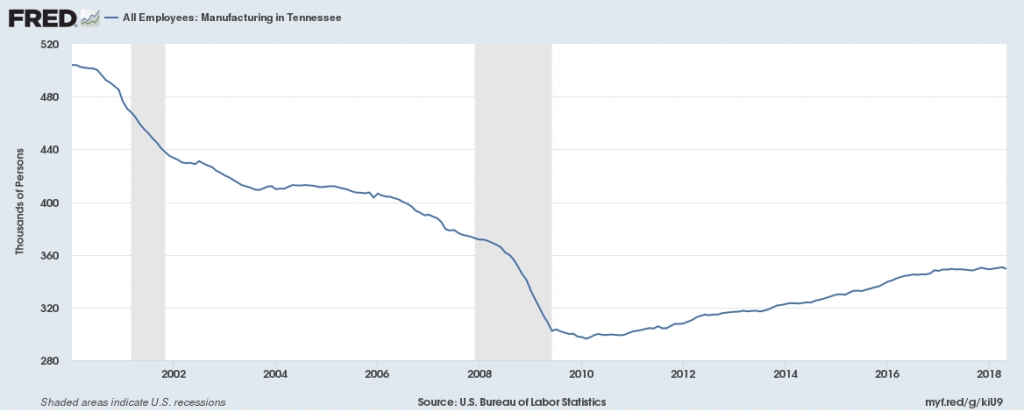
Manufacturing employment has decreased since 2000, especially during the recession, but increased mildly since 2010. There were 355,000 jobs in this sector in 2018, up from 296,000 in 2010 but below pre-recession levels. Average hourly wages of production employees have been increasing since 2010, going from $15/hr in 2010 to $19.75/hr in 2018.
There were 168,000 jobs in the Transportation and Warehousing sector in 2018, above pre-recession levels by 24,000 jobs, showing growth in this sector. The average wage in this sector was $20/hr in 2018, growing from $18/hr in 2008.
![]()
![]()
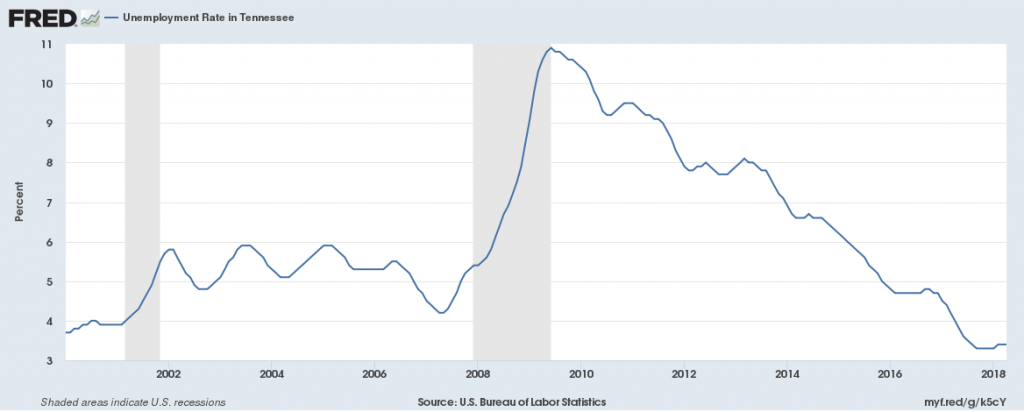
Unemployment
The unemployment rate in 2018 is 3%, down from the prior year’s 3.4% rate. This is below the national average of 3.9% unemployment.
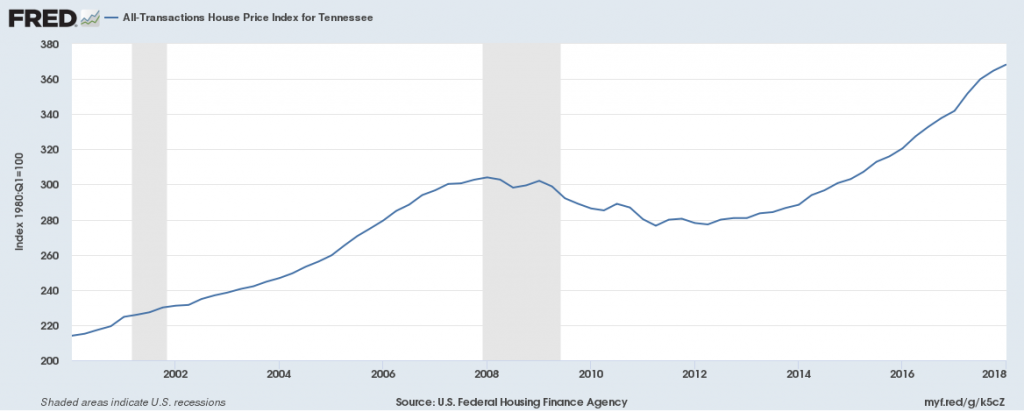
Housing
The House Price Index, a measure of the cost of housing, declined after 2008 until 2012 when it began to grow from 280 to 370 by 2018, showing increased housing costs above pre-recession levels.