Gross Domestic Product
Real GDP (a measure of economic growth) increased from 2009-2017 from the 2009 low of $1.15 trillion to $1.525 trillion in 2017.
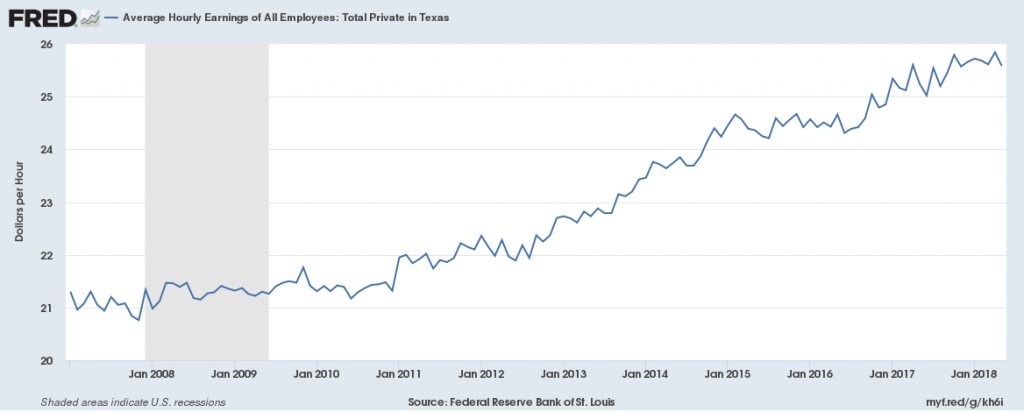
Jobs
Private-sector employers have added 2,200,000 jobs since 2010, the national low point for private-sector employment. From 2017 to 2018 the private sector has added approximately 300,000 net new jobs for a total of 10,600,000 putting it above the 2008 pre-recession high of 8,900,000 total jobs. Average hourly wages in the private sector have grown since 2008, going from $21/hr to $25.50/hr in 2018.
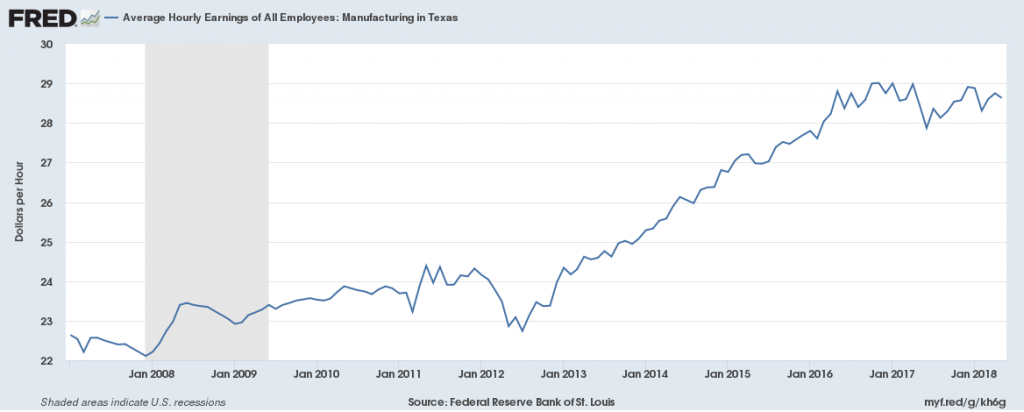
Manufacturing employment has decreased since 2000, especially during the recession. There were 870,000 jobs in this sector in 2018, down from 1,080,000 in 2000 and below pre-recession levels. Average hourly wages of manufacturing employees have been increasing since 2012, going from $22/hr in 2012 to $29/hr in 2018.
There were 555,000 jobs in the Transportation and Warehousing sector in 2018, above pre-recession levels by 130,000 jobs, showing growth in this sector. The average wage in this sector was $23/hr in 2018, down from $28/hr in 2008.
![]()
![]()
Unemployment
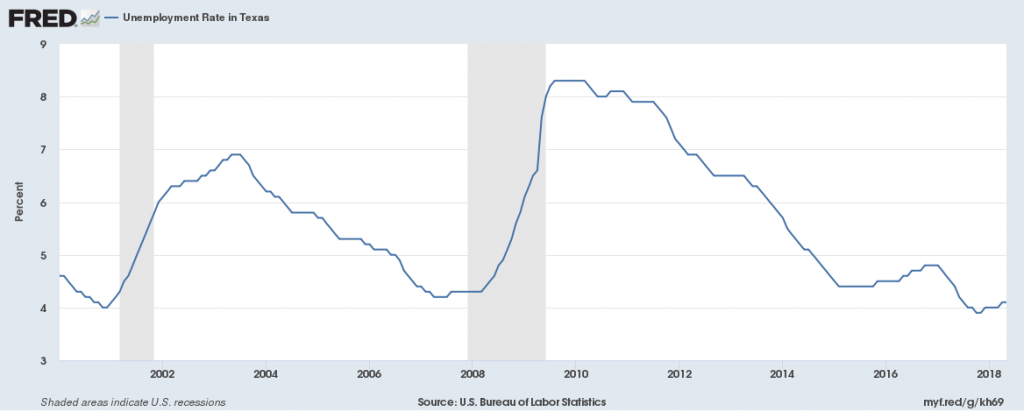
The unemployment rate in 2018 is 4.1%, down from the prior year’s 4.8% rate. This is slightly above the national average of 3.9% unemployment.
Housing
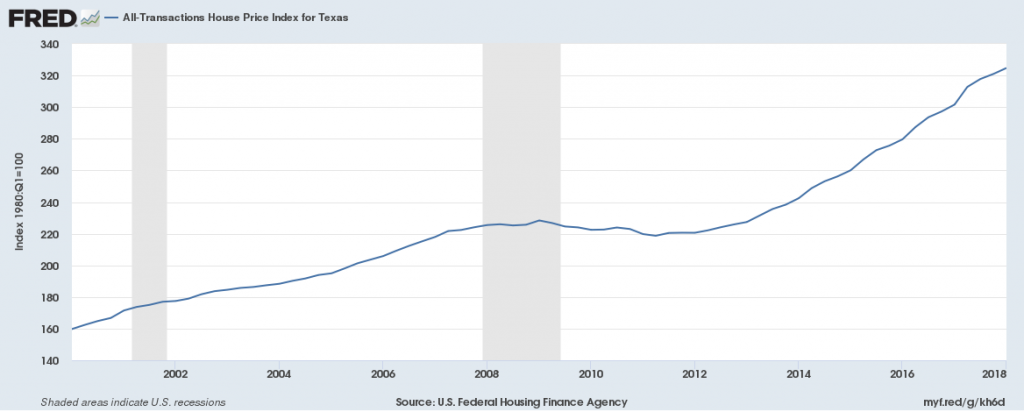
The House Price Index, a measure of the cost of housing, declined slightly after 2008 until 2012 when it began to grow from 220 to 320 by 2018, showing increased housing costs above pre-recession levels.
Houston-The Woodlands-Sugar Land
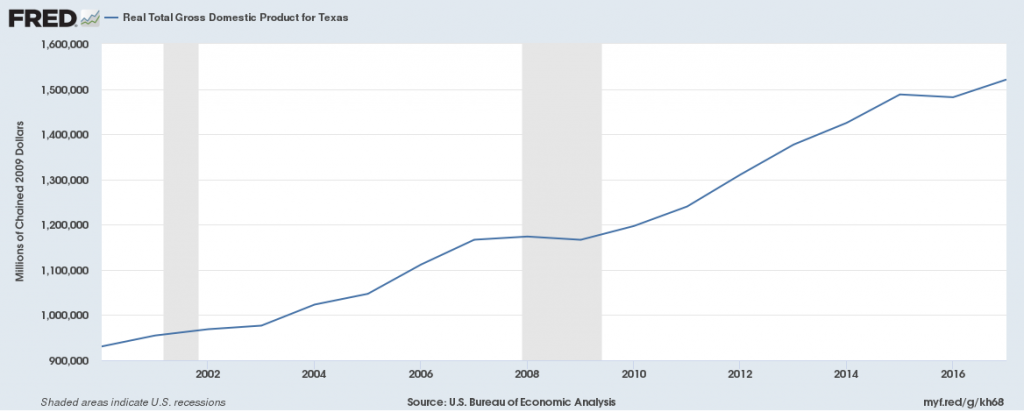
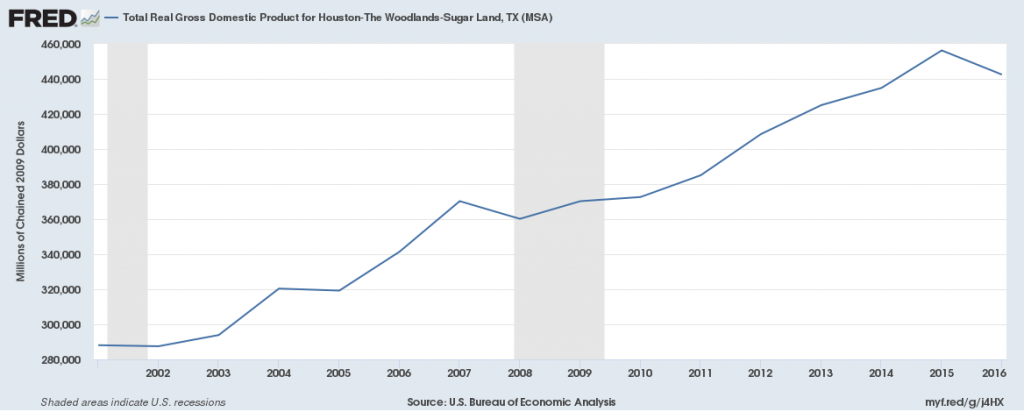
Gross Domestic Product
Real GDP (a measure of economic growth) increased from 2008-2016 from the 2008 low of $360 billion to $442.5 billion in 2016.
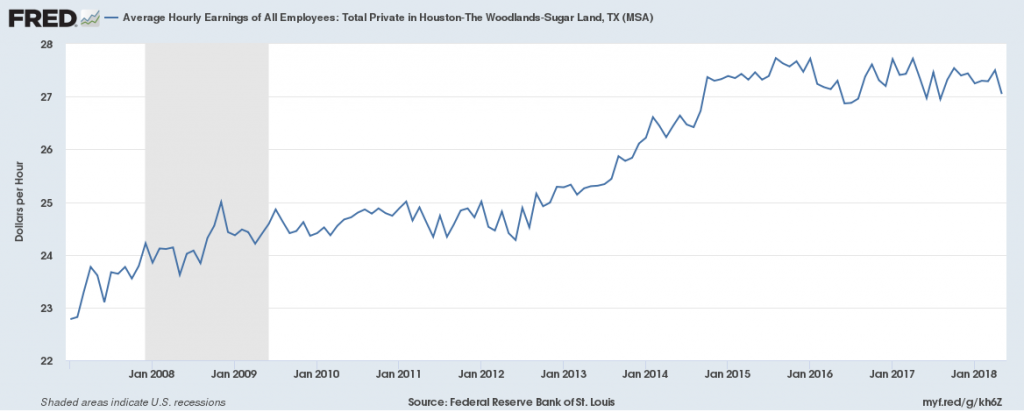
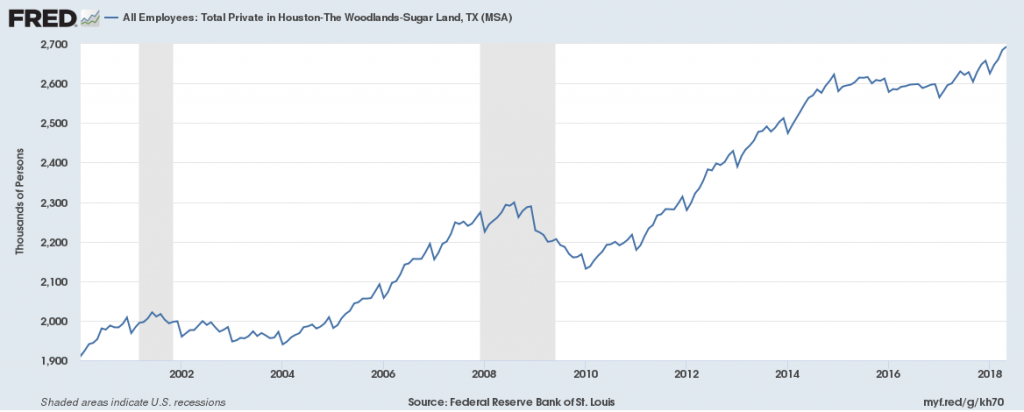
Jobs
Private-sector employers have added 550,000 jobs since 2010, the national low point for private-sector employment. From 2017 to 2018 the private sector has added approximately 110,000 net new jobs for a total of 2,700,000 putting it above the 2008 pre-recession high of 2,300,000 total jobs. Average hourly wages in the private sector have grown since 2008, going from $22.80/hr to $27/hr in 2018.
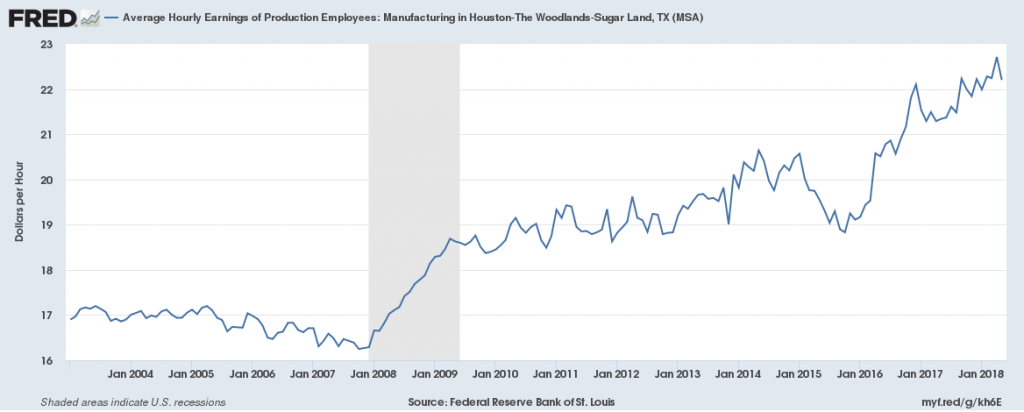
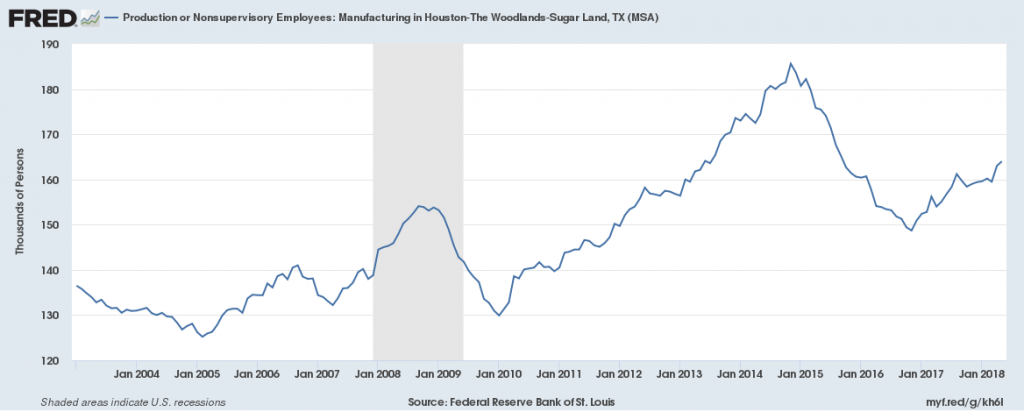
Manufacturing employment has increased since 2009. There were 145,000 jobs in this sector in 2018, above both 2000 and pre-recession levels. Average hourly wages of production employees have been increasing since 2008, going from $16.25/hr in 2012 to $22.25/hr in 2018.
There were 555,000 jobs in the Transportation and Warehousing sector in 2018, above pre-recession levels by 130,000 jobs, showing growth in this sector. The number of people working in Air Transportation has declined since 2008, going from 26,000 to 21,500. The average wage in this sector was $19.78/hr in 2018.
![]()
Unemployment
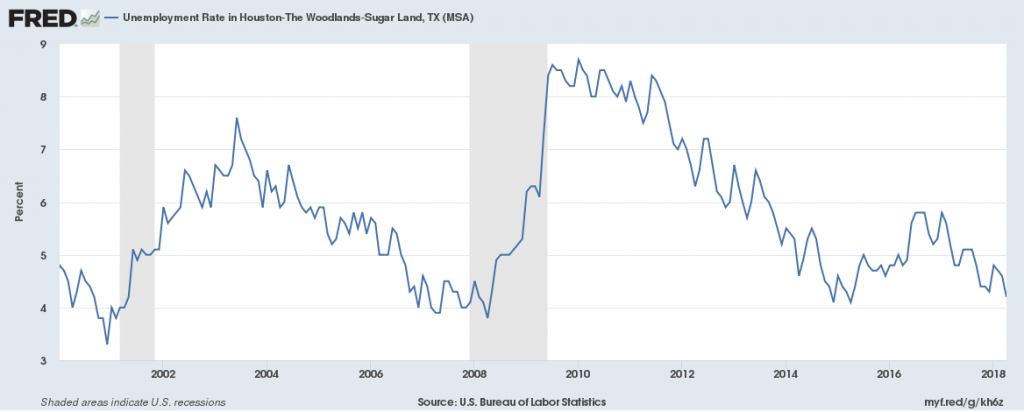
The unemployment rate in 2018 is 4.3%, down from the prior year’s 5.8% rate. This is above the national average of 3.9% unemployment.
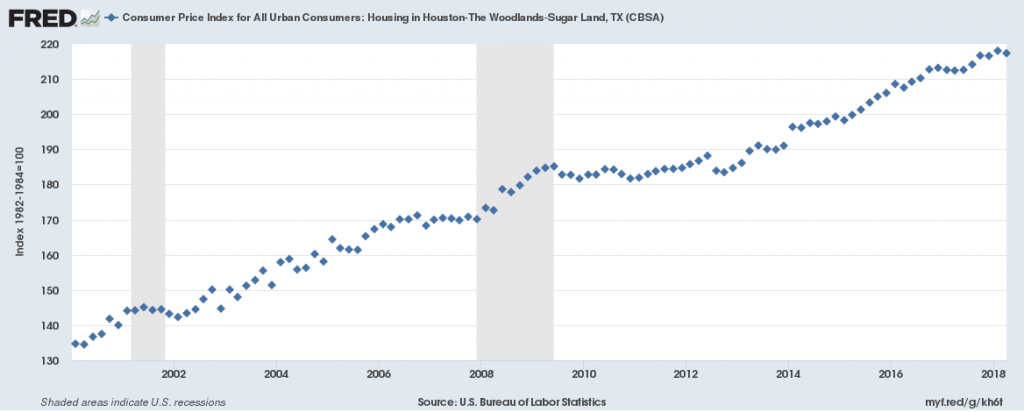
Housing
The Consumer Price Index for Housing slightly has increased consistently since 2000, even during the recession, growing from 170 in 2008 to 220 in 2018, showing an increase in housing costs. The Consumer Price Index for All Items, a measure of cost of living, has increased similarly, going from 190 to 225 during the same time.