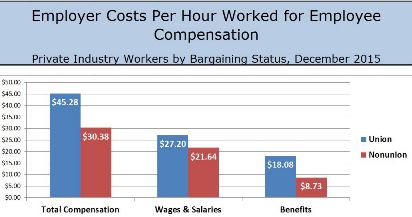
Source: Bureau of Labor Statistics
The average nonunion worker earned about 20 percent less than the average unionized employee worker in wages alone.
The average nonunion worker earned about 33 percent less than the average unionized employee in total compensation.
Some of the most important benefits that workers get from Union membership are impossible to put a price tag on: representatives in the workplace of our own choosing, an active, collective voice to bargain over working conditions, and due process on the job. As union members, we know that collective bargaining is the best way to promote basic, democratic principles of fairness and dignity at work. But being in a union confers significant economic benefits as well. Unions have historically been the most effective institutions in our society at making sure the economic gains that workers help to create are shared widely rather than being channeled solely to the executive suite. The data below illustrates “The Union Difference” and shows why more and more people are joining unions today.
| Union Difference – Annually 2015 | ||||
| Union Status | Median Wkly. Earnings | Any Retirement Benefits | Defined Benefit Pension | Medical Benefits |
| Union | $980 | 86% | 76% | 83% |
| Non-Union | $776 | 48% | 16% | 62% |
| Number of Union Members in the United States: 16.4 million | ||||
| Percentage of Workers Who Belong to Unions | ||
| United States | 11.1% | |
| Public Sector | 35.2% | |
| Local Government Workers | 41.3% | |
| State Government Workers | 30.2% | |
| Federal Government Workers | 27.3% | |
| Private Sector | 6.7% | |
| Utilities | 21.4% | |
| Information Industries (includes Telecommunications) | 8.6% | |
| Telecommunications | 13.3% | |
| Construction | 13.2% | |
| Manufacturing | 9.4% | |
| Transportation & Warehousing | 19.3% |
|
| Occupational Groups | ||
| Education, Training & Library | 35.5% | |
| Protective Service Workers | 36.3% | |
| Transportation and Material Moving | 14.2% | |
| Construction and Extraction | 17.2% | |
| Installation, Maintenance & Repair | 14.7% | |
| Production | 12.6% | |
| Community & Social Services | 15.3% | |
| Sales & Related | 3.3% | |
| Farming, Fishing & Forestry | 1.9% | |
Sources: U.S. Bureau of Labor Statistics, “Union Members – 2015, and AFL-CIO “The Union Difference”
Click here for additional information offered by the AFL-CIO on “The Union Difference”
Updated 3/11/2016 by IAM&AW Strategic Resources Department